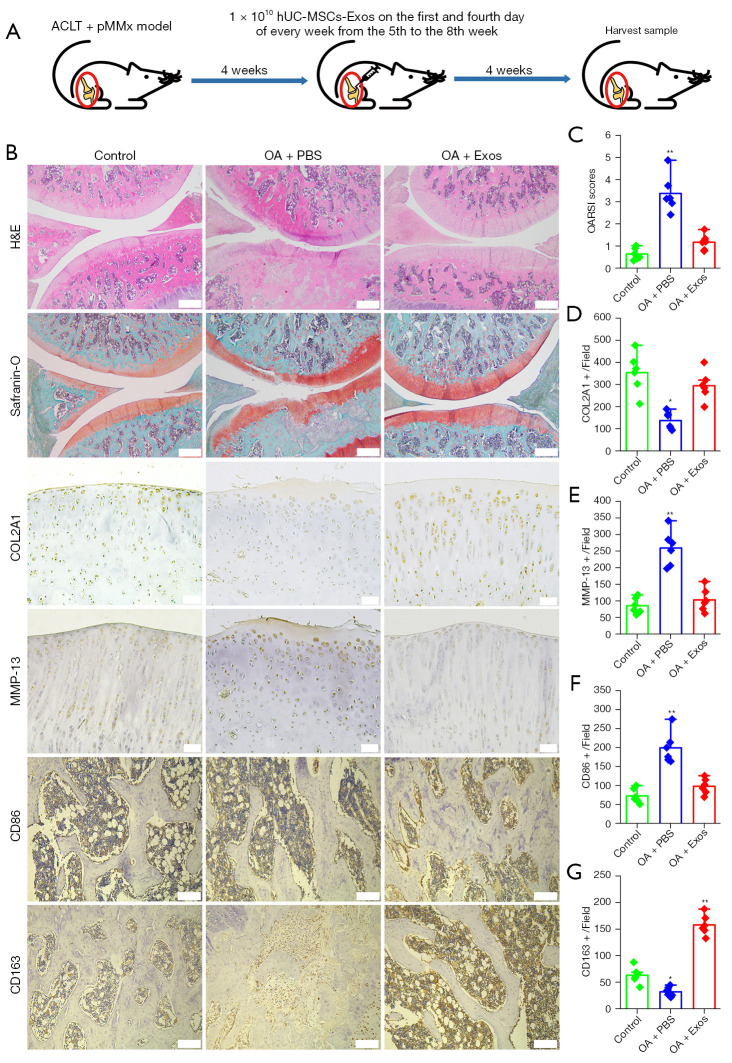
Figure 2.
hhUC-MSCs-Exos prevent OA. (A) Flowchart of the in vivo experiment. (B) Staining results of H&E, safranin-O and fast green staining (scale bar: 500 μm), and immunohistochemical staining for COL2A1, MMP-13 (scale bar: 50 μm), CD86, and CD163 (scale bar: 200 μm). (C) Statistical results of chondrocytes counted in randomly selected field from each sample and the result of statistical analysis of the OARSI score in each group. Data are represented as mean ± SD. **, P<0.01 compared to the normal (n=6) by non-parametric test. (D-G) Statistical results of COL2A1+, MMP-13+, CD86+, and CD163+ cells counted in randomly selected field from each sample. Data are represented as mean ± SD. *, P<0.05; **, P<0.01 compared to the normal (n=6) by independent-samples Student’s t-test with Bonferroni correction. ACLT + pMMx, anterior cruciate ligament transection in combination with medial meniscectomy; hUC-MSCs-Exos, hUC-MSCs-derived exosomes; hUC, human umbilical cord; MSC, mesenchymal stem cell; OA, osteoarthritis; PBS, phosphate-buffered saline; OARSI, Osteoarthritis Research Society International; H&E, hematoxylin and eosin; SD, standard deviation.

