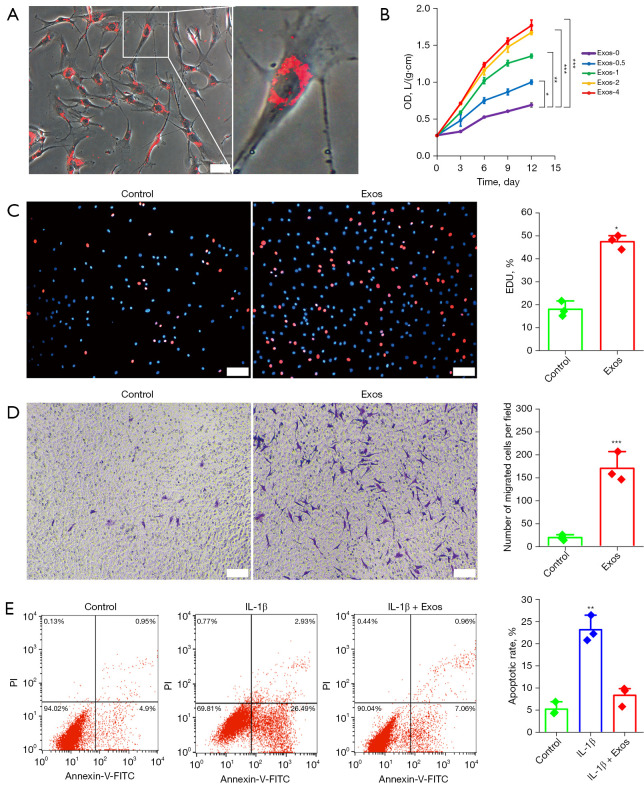
Figure 3.
Effects of hUC-MSCs-Exos on proliferation and migration in chondrocytes. (A) Representative immunofluorescence photomicrograph of PKH26 (red)-labeled exosomes absorbed by chondrocytes (light field) on the right is an enlarged image of chondrocytes with exosomes internalized. Scale bar: 50 µm. (B) hUC-MSCs-Exos were treated with chondrocytes at different concentrations. Quantitative data are presented as means ± SD of 3 independent experiments. *, P<0.05; **, P<0.01; ***, P<0.001, independent-samples Student’s t-test with Bonferroni correction. (C) EdU-positive cells and representative images of fields showing red-colored proliferative cells. Hoechst 33342 staining was performed to detect nuclear localization (blue color). Scale bar: 100 µm. Percentage of EdU was plotted as the mean ± SD of triplicate samples from 3 independent experiments. *, P<0.05, by independent-samples Student’s t-test. (D) Migrated chondrocytes were stained by crystal violet. Scale bar: 100 µm. Migrated chondrocytes was plotted as the mean ± SD of triplicate samples from 3 independent experiments. ***, P<0.001, independent-samples Student’s t-test. (E) Annexin V-PI staining combined with flow cytometry assay to detect anti-apoptosis of hUC-MSCs-Exos in IL-1β-treated chondrocytes. **, P<0.01, independent-samples Student’s t-test with Bonferroni correction. hUC-MSCs-Exos, hUC-MSCs-derived exosomes; hUC, human umbilical cord; MSC, mesenchymal stem cell; OD, optical density; EdU, 5-ethynyl-2'-deoxyuridine; IL-1β, interleukin 1 beta; PI, propidium iodide; FITC, fluorescein isothiocyanate; SD, standard deviation.

