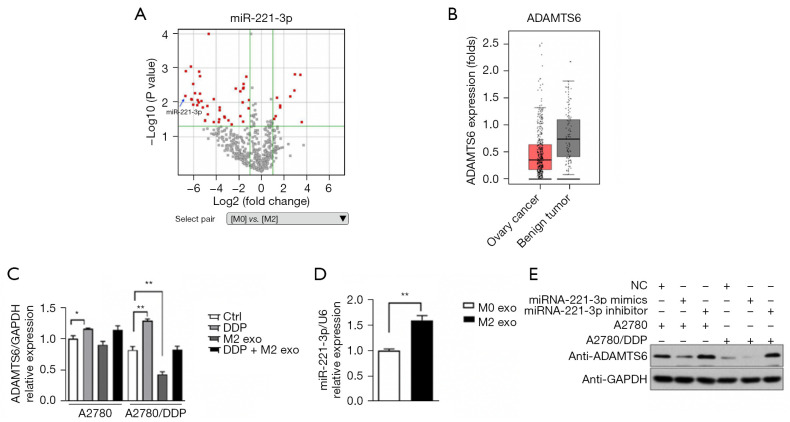
Figure 5.
Expression of miR-221-3p and ADAMTS6. (A) Differences in the results of microarray analysis of M0 and M2 (CD163+ TAMs) cells. Volcano plot of gene analysis: miR-221-3p was highly expressed in M0 and M2 (CD163+ TAMs) cells (FC =105.22828, P=0.064). (B) ADAMTS6 expression in ovarian cancer cells and benign lesions derived from TCGA database (ovarian cancer =426, benign tumor =85). (C) CD163+ TAM exosomes (M2 exo) decreased ADAMTS6 expression after co-culture with A2780/DDP cells. (D) The mRNA level of miR-221-3p was increased in CD163+ TAM exosomes (M2 exo) compared to M0 exo. (E) A2780 and A2780/DDP cells were transfected with miR-221-3p mimics or inhibitors and their respective negative controls. After 72 h of incubation, ADAMTS6 protein levels were determined by Western blotting. MiR-221-3p negatively regulated ADAMTS6 protein expression (exo 100 µg, n=6). *, P<0.05; **, P<0.01. Ctrl, control; DDP, cis-diamminedichloroplatinum; exo, exosomes; FC, fold change; NC, negative control.

