
Figure 2.
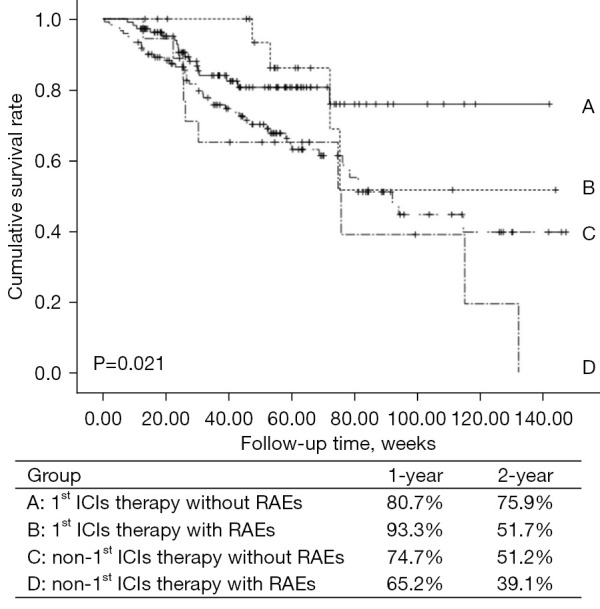
Survival curves for patients with and without RAE during ICIs therapy. Log-rank tests were performed to identify the differences among the groups, P=0.021. RAE, renal adverse event; ICIs, immune checkpoint inhibitors.
Official websites use .gov
A
.gov website belongs to an official
government organization in the United States.
Secure .gov websites use HTTPS
A lock (
) or https:// means you've safely
connected to the .gov website. Share sensitive
information only on official, secure websites.
Survival curves for patients with and without RAE during ICIs therapy. Log-rank tests were performed to identify the differences among the groups, P=0.021. RAE, renal adverse event; ICIs, immune checkpoint inhibitors.