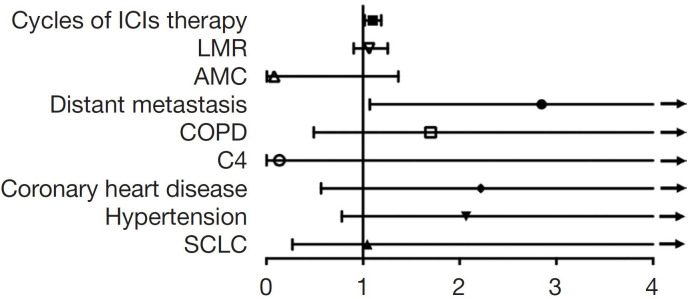
Table 3. Risk factors for the development of renal adverse events in multivariable analysis.
| Variable | β | OR (95% CI) | P value | Forest plot |
|---|---|---|---|---|
| Cycles of ICI therapy | 0.096 | 1.101 (1.019–1.188) | 0.014 |

|
| LMR | 0.062 | 1.064 (0.904–1.254) | 0.455 | |
| AMC | −2.496 | 0.081 (0.005–1.366) | 0.081 | |
| Distant metastasis | 1.046 | 2.847 (1.07–7.577) | 0.036 | |
| COPD | 0.531 | 1.701 (0.492–5.885) | 0.402 | |
| C4 | −2.0 | 0.135 (0.002–7.811) | 0.334 | |
| Coronary heart disease | 0.797 | 2.219 (0.565–8.715) | 0.253 | |
| Hypertension | 0.726 | 2.067 (0.78–5.48) | 0.144 | |
| SCLC | 0.043 | 1.044 (0.271–4.015) | 0.95 |
ICI, immune checkpoints inhibitor; LMR, neutrophil-to-lymphocyte ratio; AMC, absolute monocyte count; COPD, chronic obstructive pulmonary disease; C4, complement C4; SCLC, small cell lung cancer.
