Figure 10.
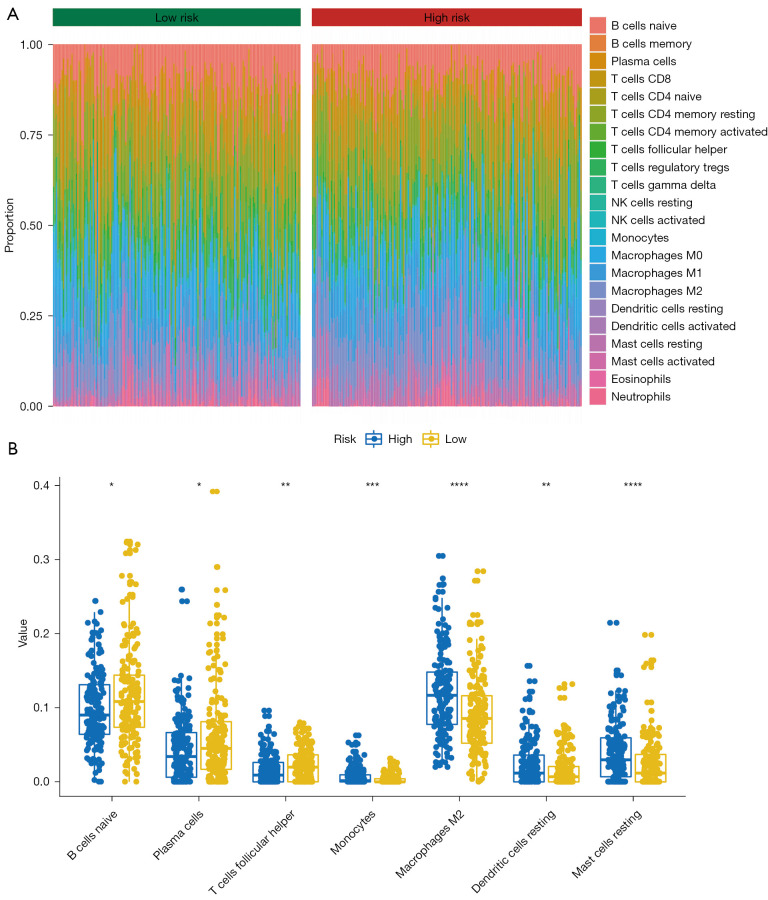
The landscape of immune infiltration in GC. (A) The infiltration proportion of the 22 types of immune infiltrating cells between the high- and low-risk groups. (B) The differences of the 7 types of immune infiltrating cells between the high- and low-risk groups. *, P<0.05; **, P<0.01; ***, P<0.001; ****, P<0.0001. GC, gastric cancer.

