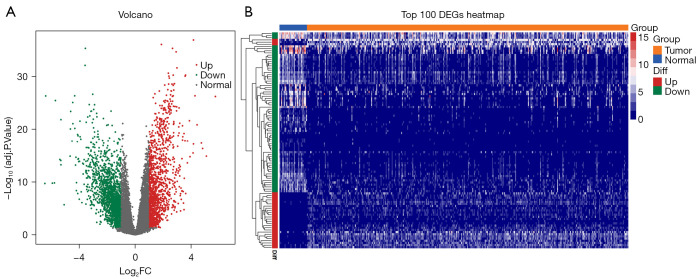
Figure 2.
Establishment of DEGs for GC in TCGA. (A) Volcano plot of the DEGs between the GC tissues and normal control tissues. Upregulated genes (red), downregulated genes (green), and DEGs that were not statistically significant (gray). (B) A heatmap of top 100 DEGs. DEG, differentially expressed gene; GC, gastric cancer; TCGA, The Cancer Genome Atlas.

