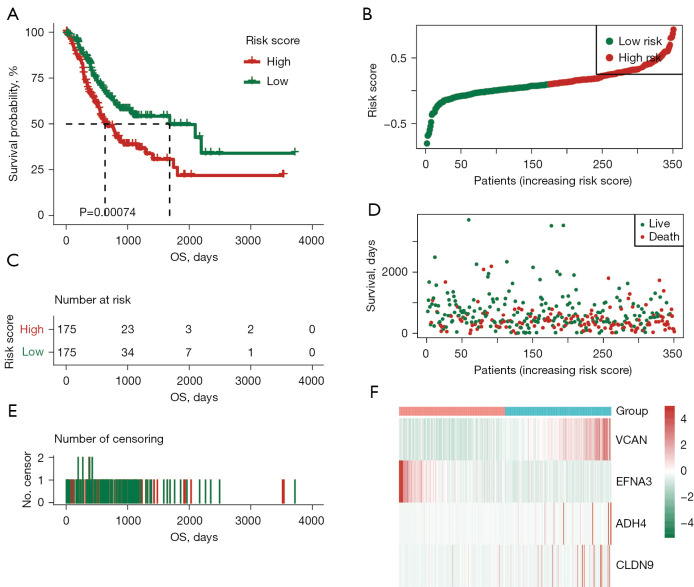
Figure 7.
Validation of the 4 glycolysis-related gene signature model in TCGA-STAD training set. (A) Kaplan-Meier survival curve analysis for the OS of GC patients from the TCGA-STAD training set. Green indicates the low-risk group. Red indicates the high-risk group. (B-E) The risk score, survival, and censoring of the high- and low-risk groups. (F) A heat map of VCAN, EFNA3, ADH4, and CLDN9 gene expression in the high- and low-risk groups. TCGA, The Cancer Genome Atlas; STAD, Stomach Adenocarcinoma; OS, overall survival; GC, gastric cancer.

