
Figure 2. Change in Plasma Levels Following Donanemab Treatment.
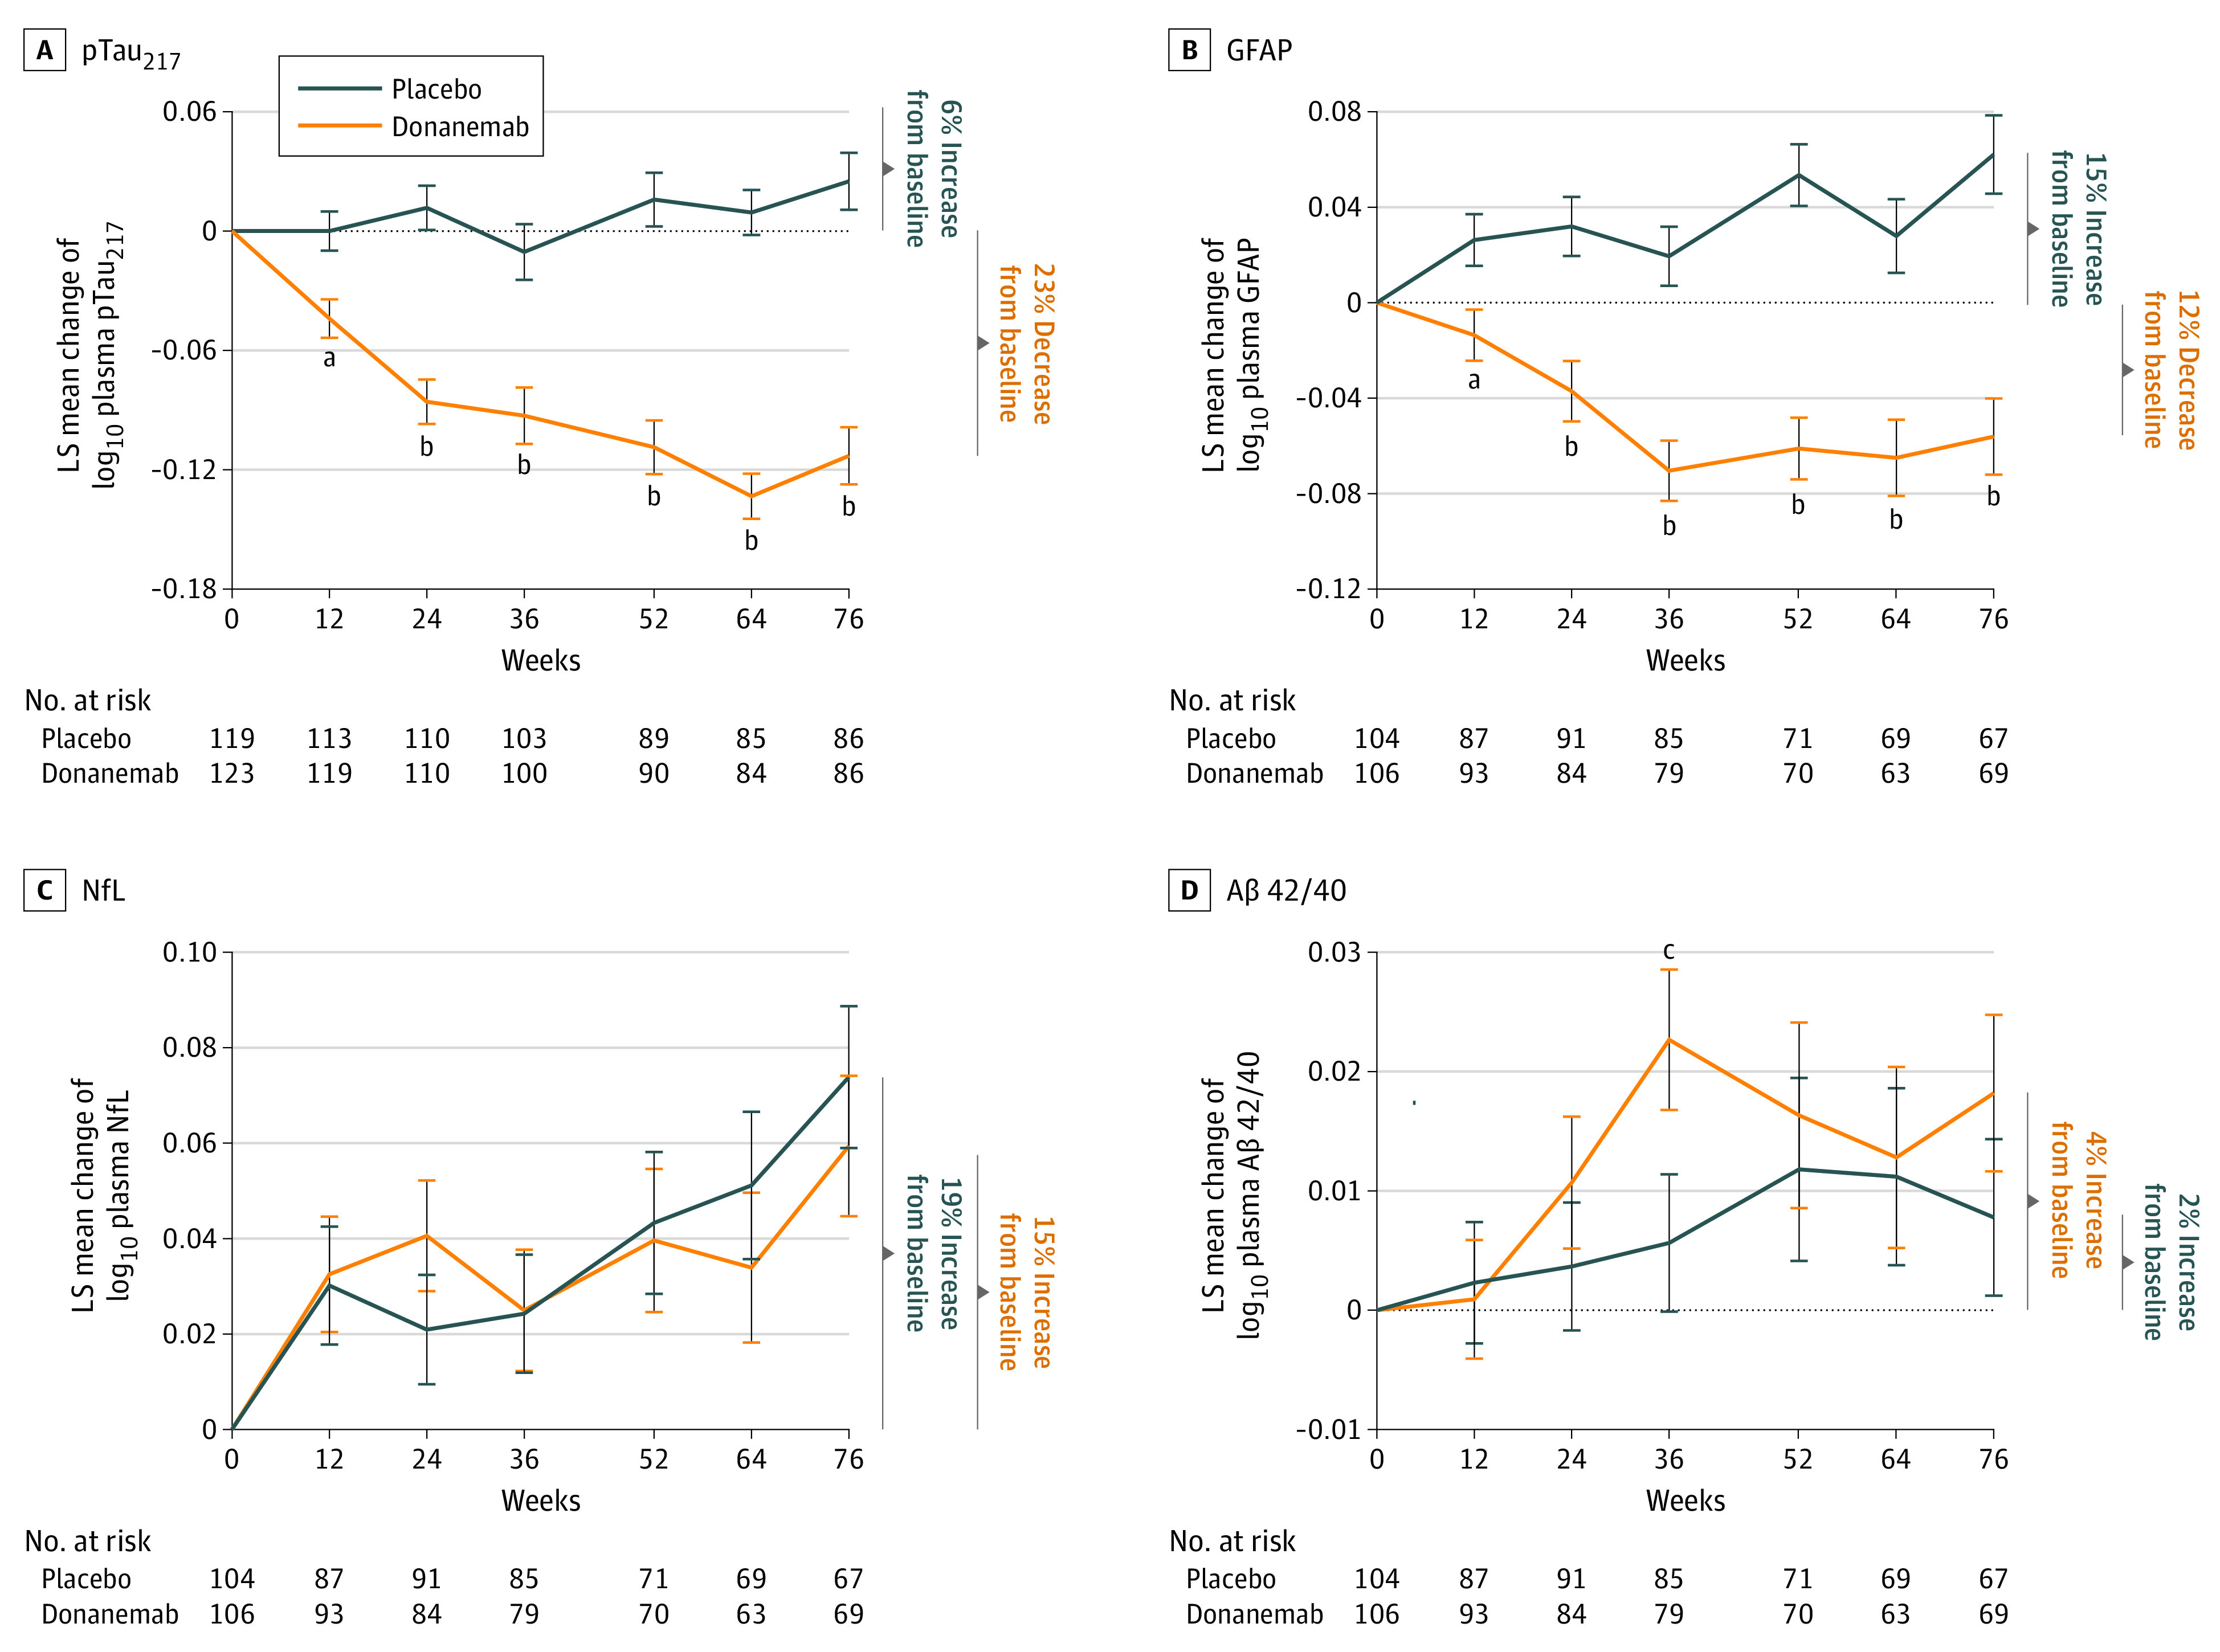
Least square (LS) mean change from baseline in plasma phosphorylated tau217 (pTAU217) (A), glial fibrillary acidic protein (GFAP) (B), neurofilament light chain (NfL) (C), and amyloid-β (Aβ) 42/40 (D) for placebo and donanemab. Plasma values were log10 transformed. Error bars indicate standard error. The dotted line indicates baseline.
aP < .01 vs placebo.
bP < .001 vs placebo.
cP < .05 vs placebo.