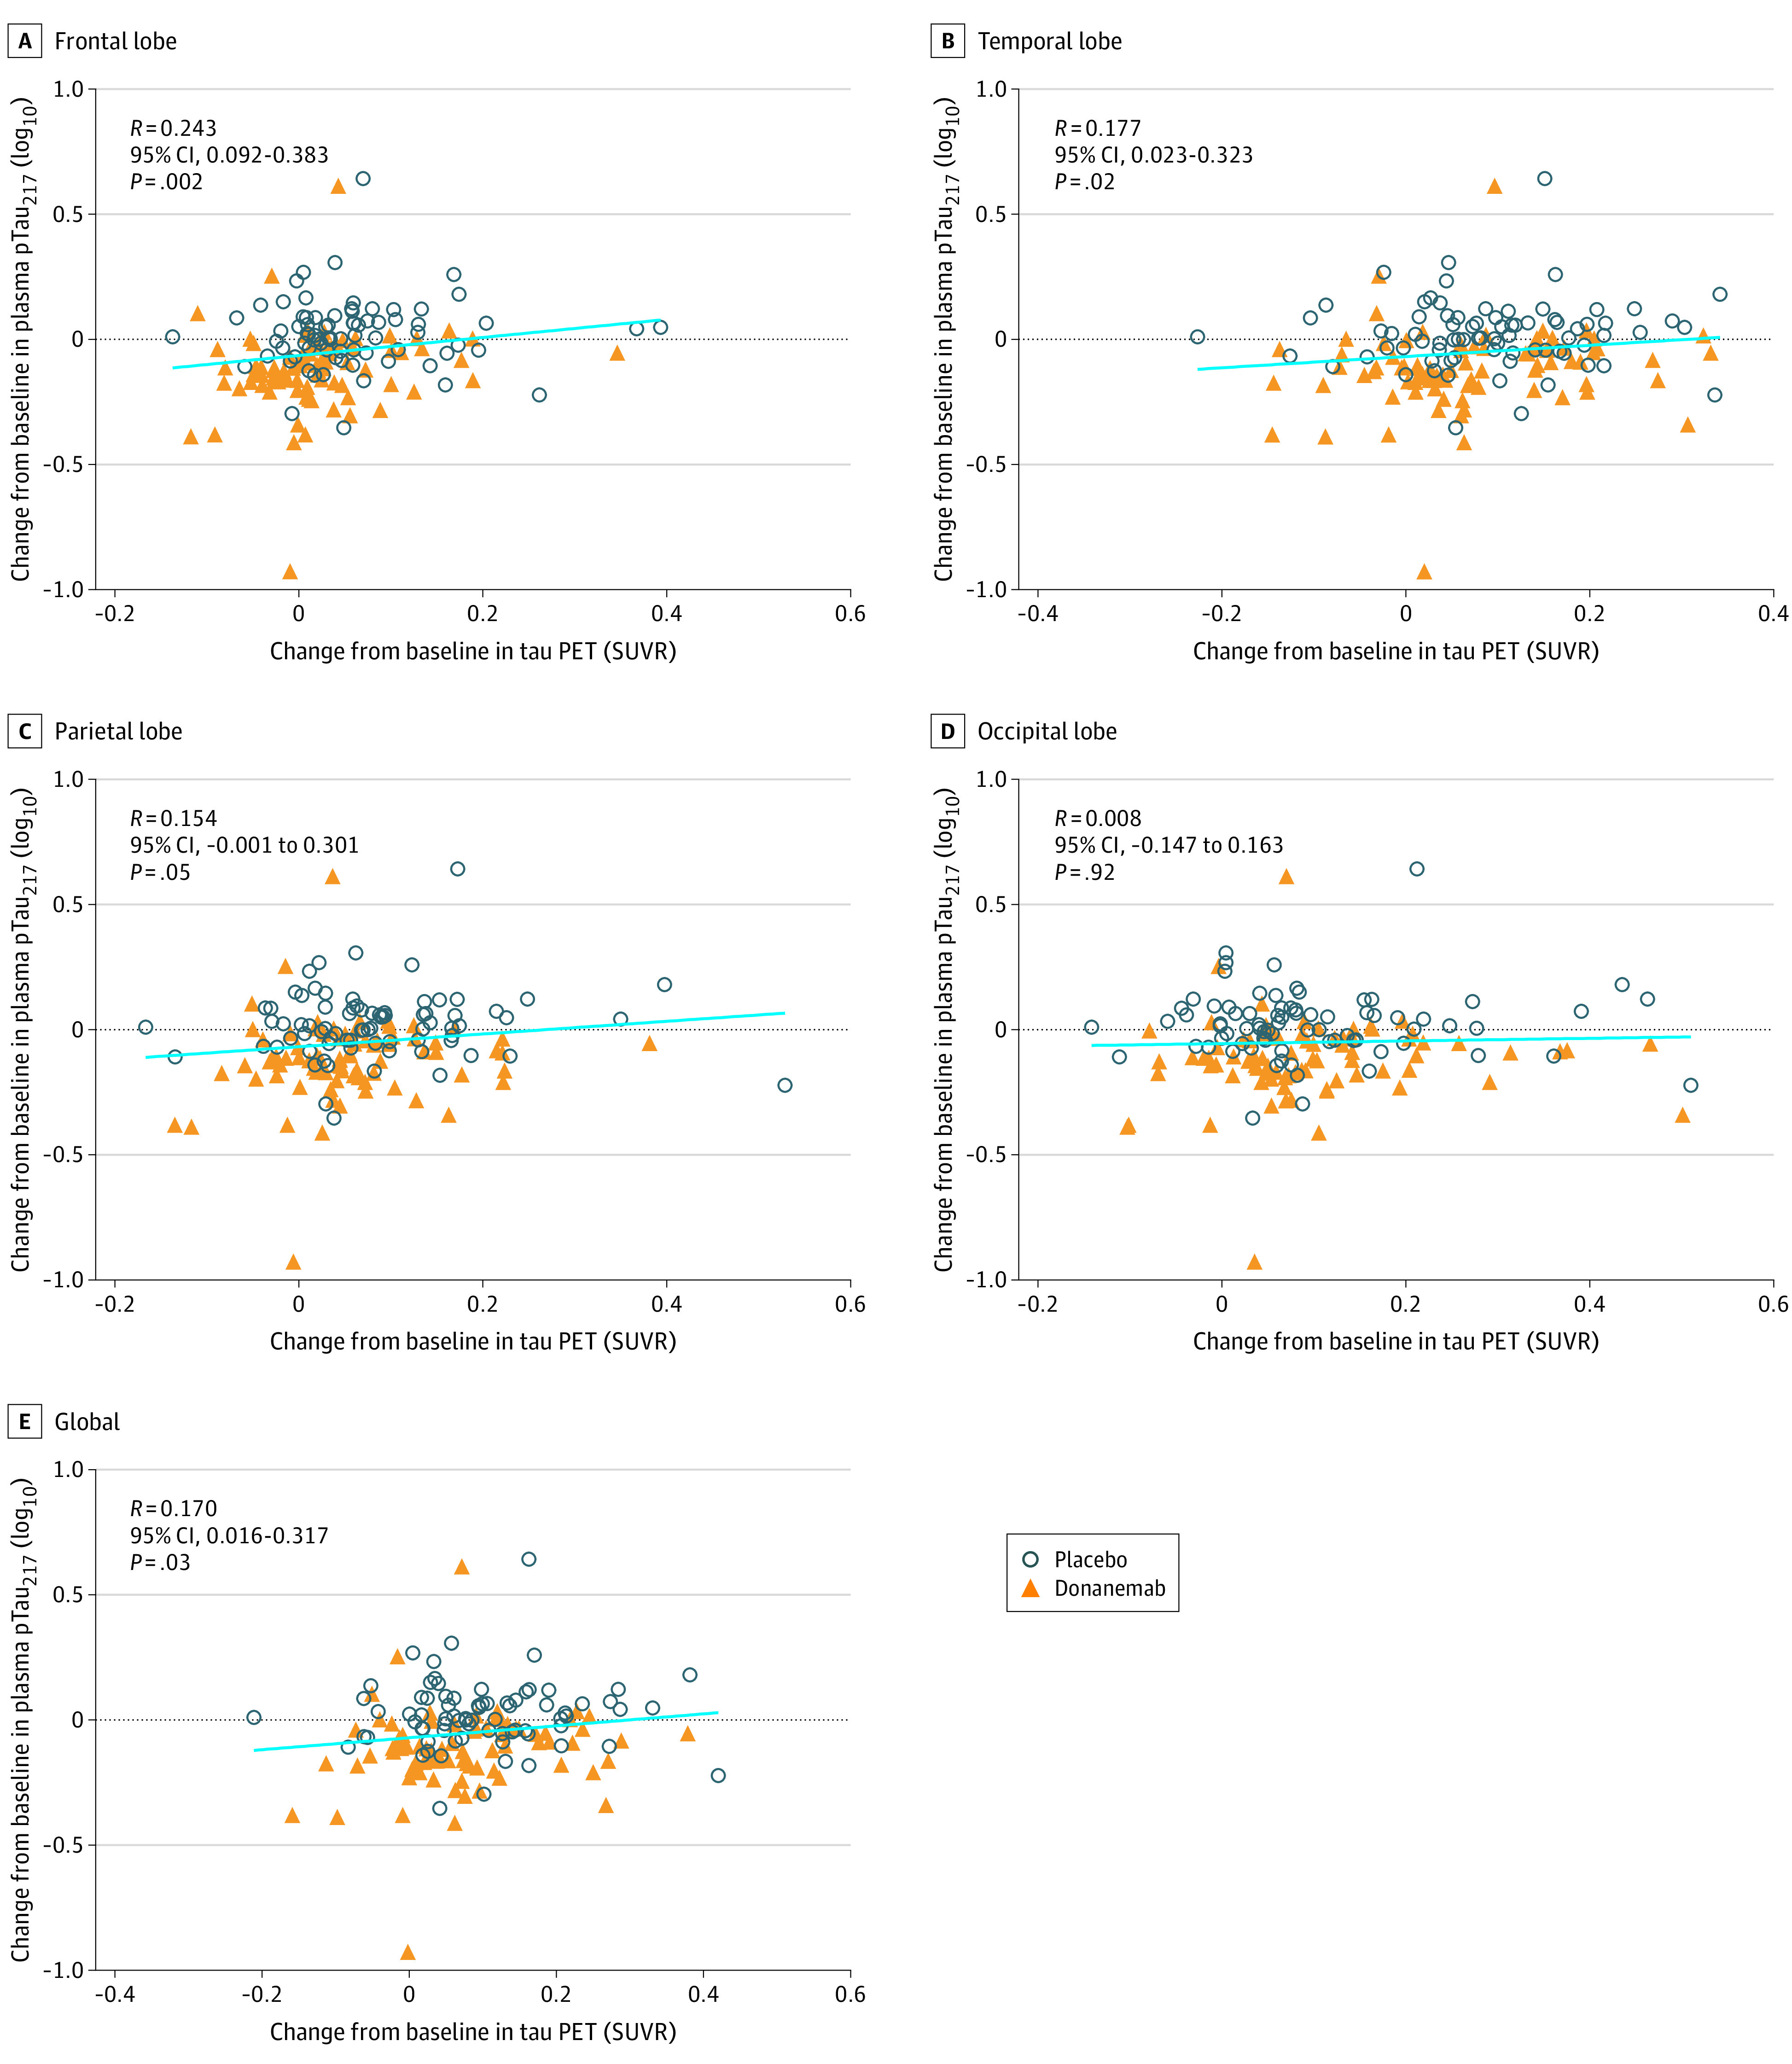
Figure 4. Correlations of Change in Plasma Phosphorylated Tau217 (pTau217) With Change in Tau Positron Emission Tomography (PET) End Points.

Change in tau PET levels compared with change in plasma pTau217 levels from baseline to 76 weeks in frontal (A), temporal (B), parietal (C), and occipital (D) lobes as well as globally (E). Plasma levels were log10 transformed. Linear regression of all data points, regardless of treatment, is shown in light blue. Spearman rank was used for correlation coefficient. There were 78 individuals in the placebo group and 83 in the donanemab group. SUVR indicates standardized uptake value ratio.
