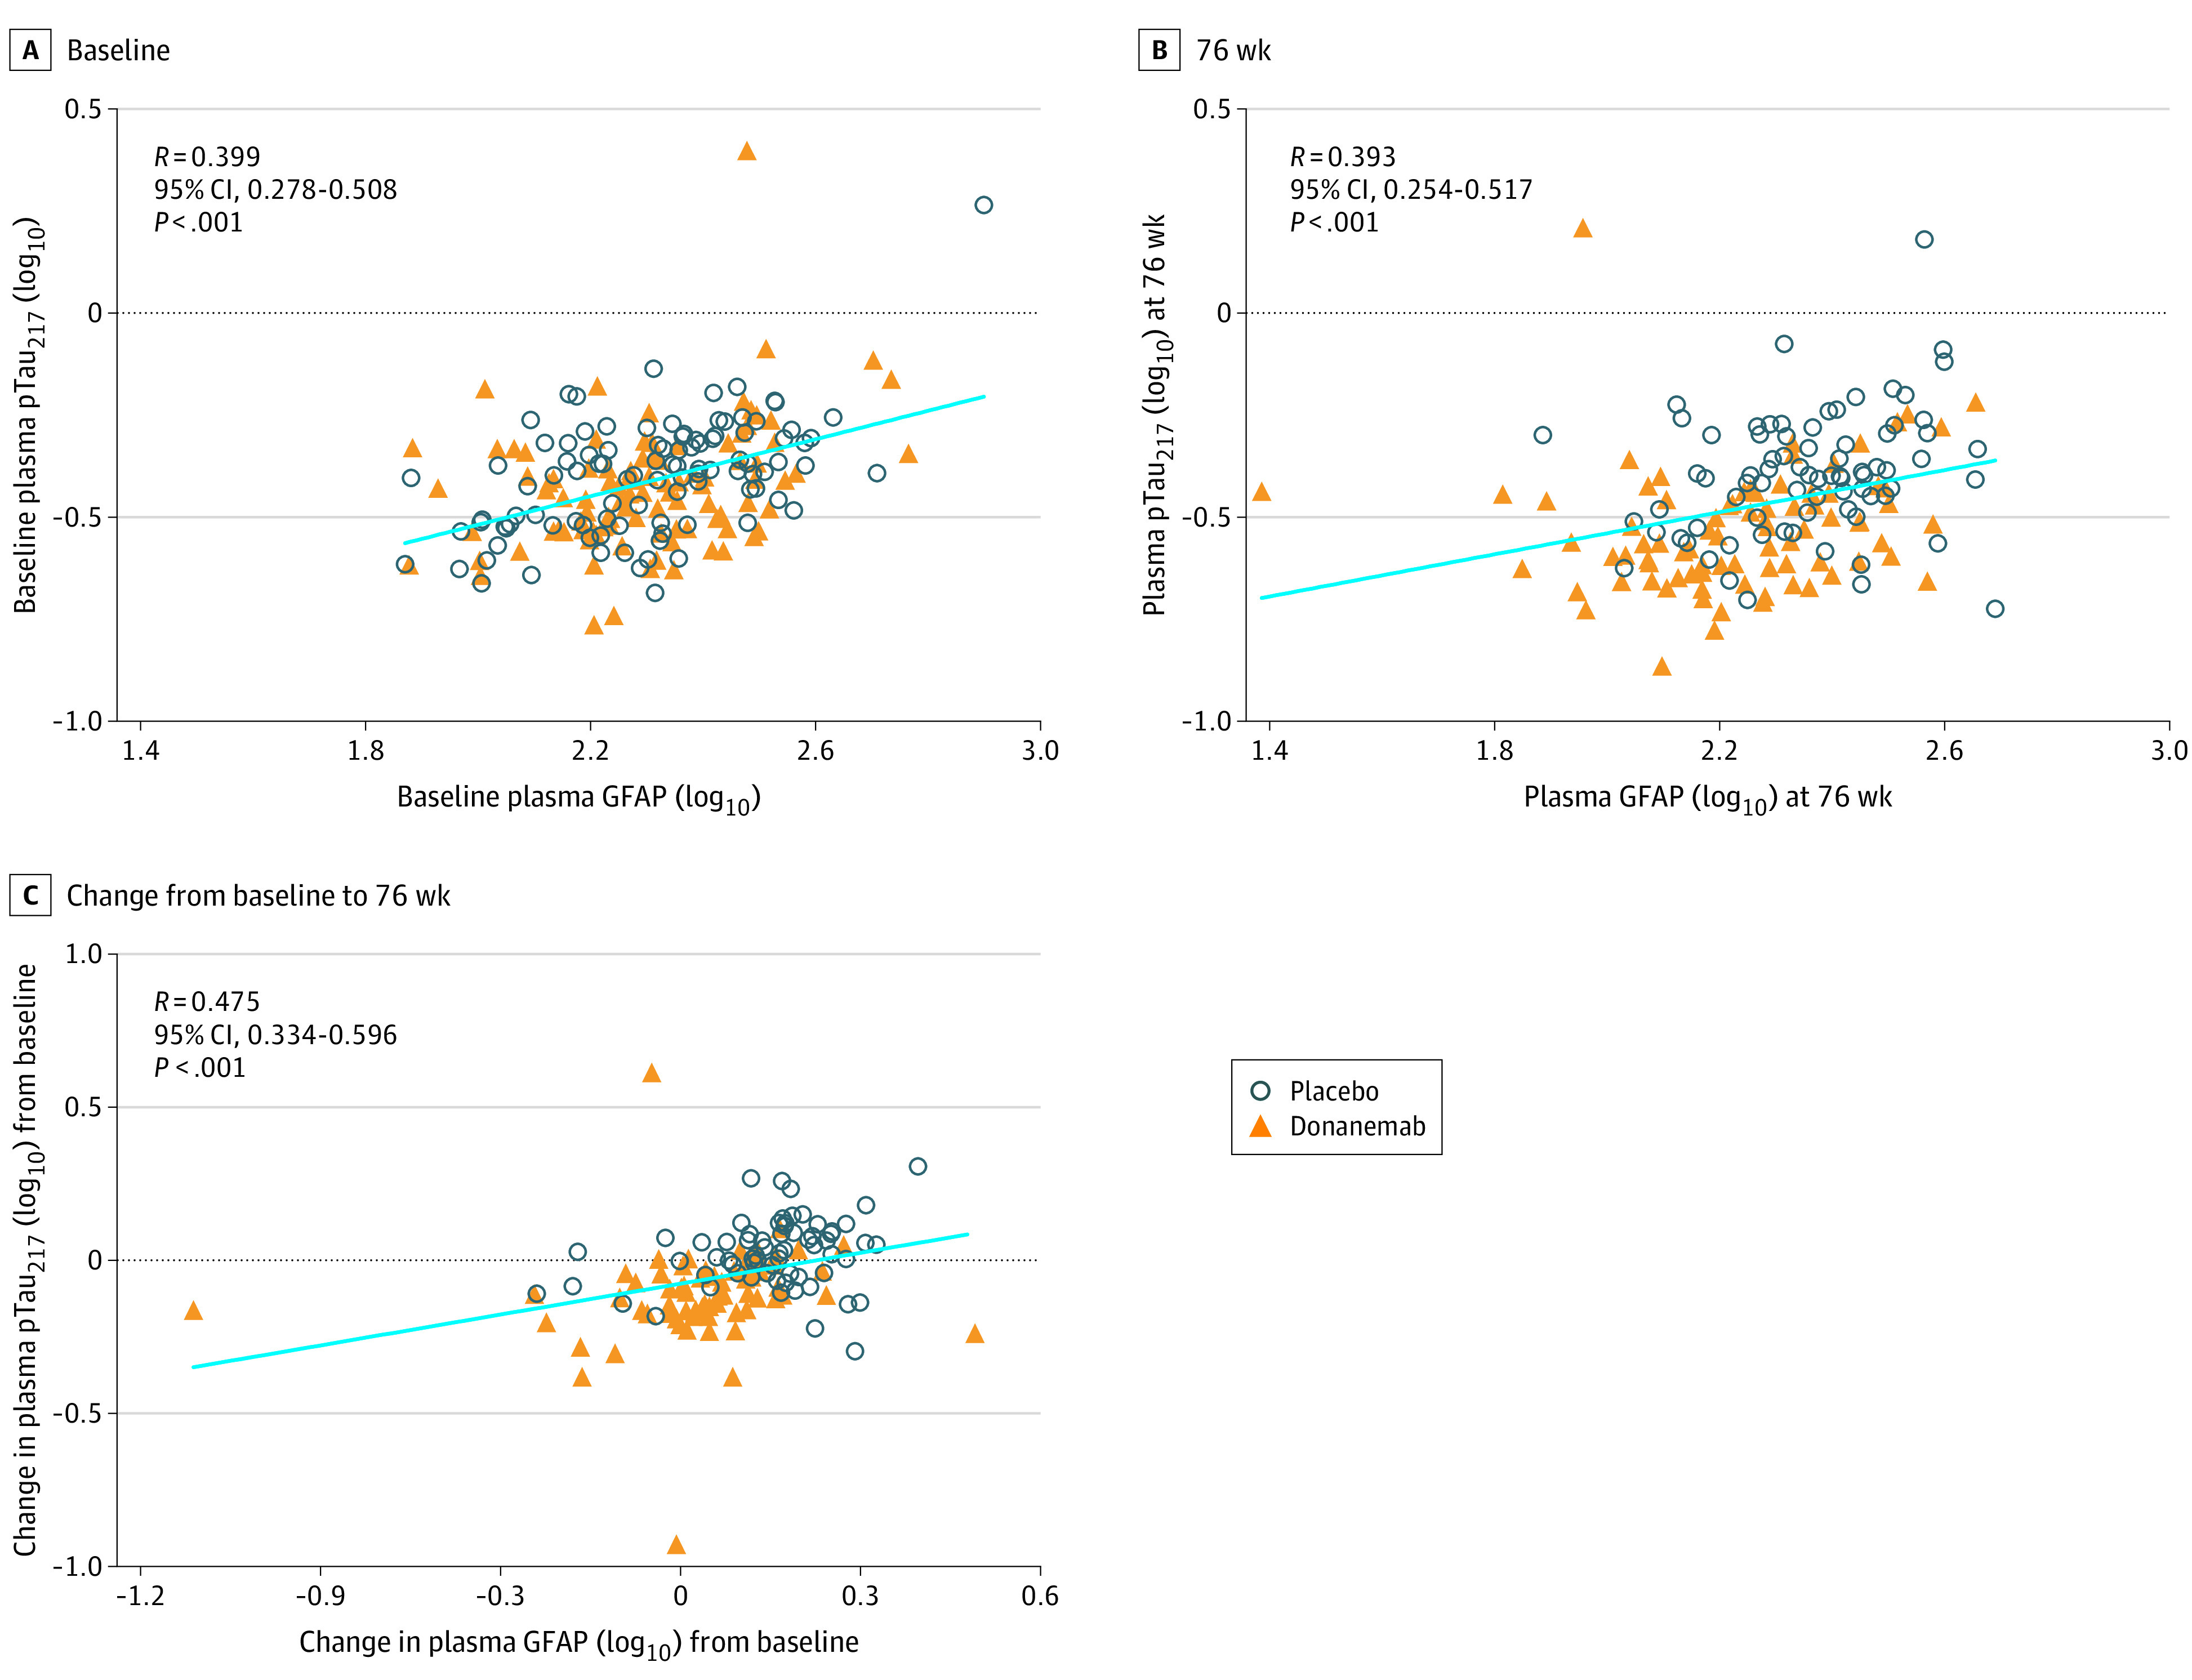
Figure 5. Correlations of Plasma Phosphorylated tau217 (pTau217) Levels With Plasma Glial Fibrillary Acidic Protein (GFAP) Levels.

Plasma GFAP levels compared with plasma pTau217 levels at baseline (placebo n = 103, donanemab n = 104) (A), 76 weeks (placebo n = 78, donanemab n = 83) (B), and change from baseline to 76 weeks (placebo n = 67, donanemab n = 69) (C). Plasma levels were log10 transformed. Linear regression of all data points, regardless of treatment, is shown in light blue. Spearman rank was used for correlation coefficient.
