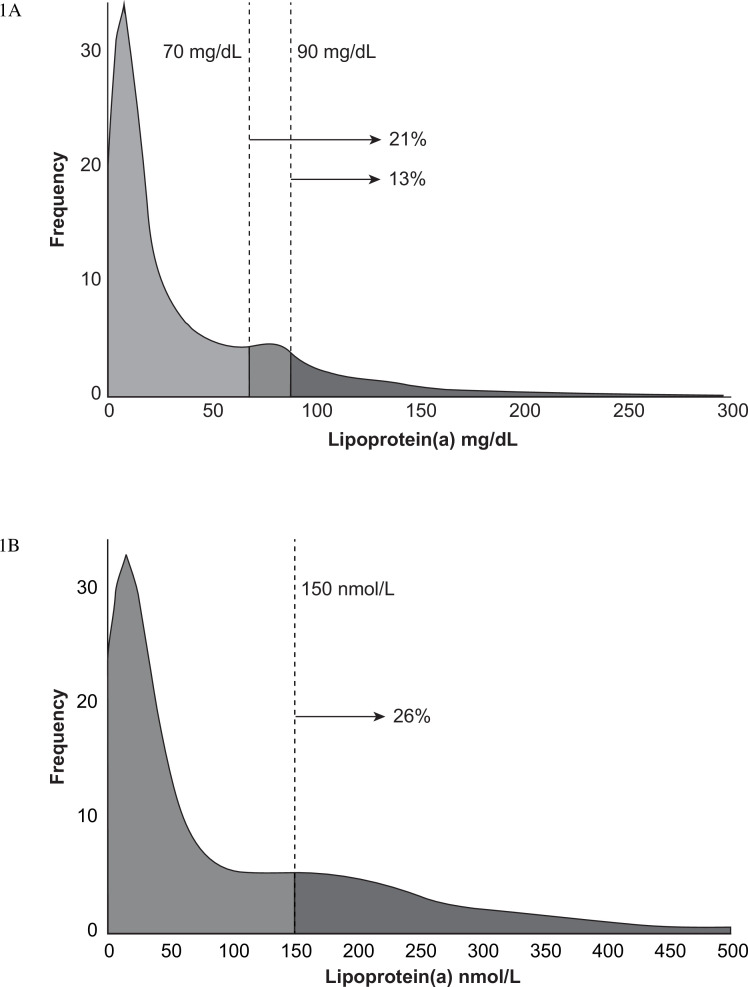
Figure 1.
(A) Frequency of lipoprotein(a) (Lp(a)) measurements for patients whose values were measured in mg/dL. The fraction of patients with values f ≥70 and 90 mg/dL (21% and 13%, respectively) are indicated by vertical lines. (B) Frequency of Lp(a) measurements for patients whose values were measured in nmol/L. The fraction of patients whose values were equal or above the commonly used threshold of 150 nmol/L (26%) is indicated by a vertical line.

