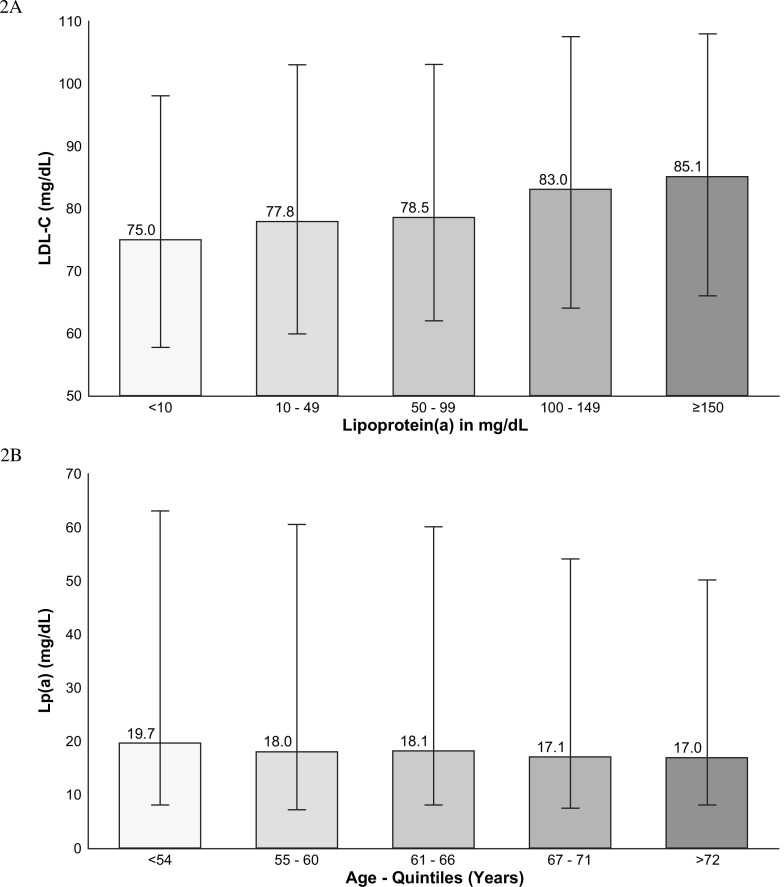
Figure 2.
(A) Relationship between lipoprotein(a) (Lp(a)) and low-density lipoprotein cholesterol (LDL-C) measurements. The bar charts demonstrate the increase in LDL-C related to lipid content of Lp(a) particles. IQR are shown for each category, <10 mg/dL, IQR 57.6–98.0; 10–49 mg/dL, IQR 60.0–103.0; 50–99 mg/dL, IQR 61.9–103.1; 100–150 mg/dL, IQR 64.6–107.5; ≥150 mg/dL, IQR 66.0–108.3. (B) Relationship between age and Lp(a) levels. Patients in the youngest quintile for age tended to have higher levels than patients in the oldest quintile. IQR, age 18–54 years, IQR 8.0–62.6; 55–60, IQR 7.1–60.6; 61–66, IQR 8.0–59.5; 67–71, IQR 7.7–54.0; 72–90, IQR 8.0–50.2.

