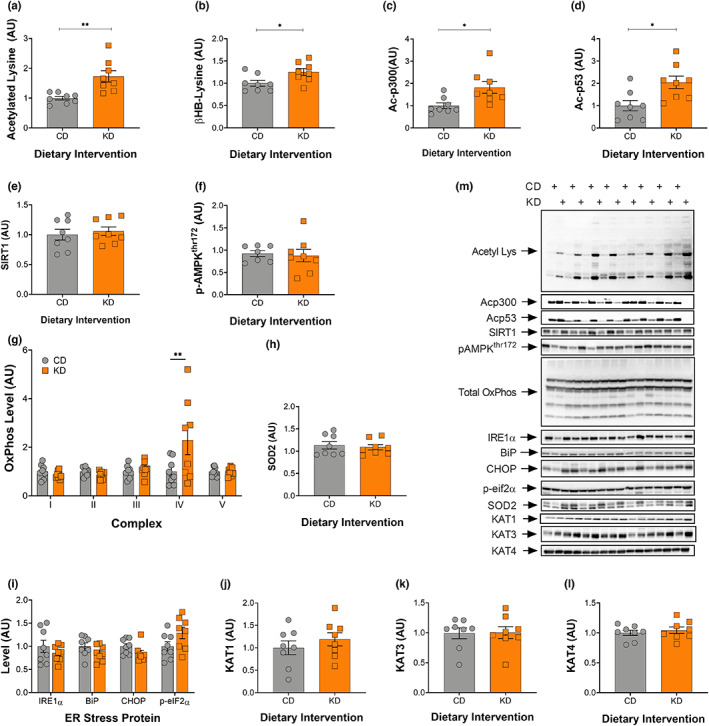
FIGURE 2.

Increased acetylation in liver is not associated with mitochondrial biogenesis after 2‐months on a ketogenic diet. Quantification of (a) acetylated lysine, (b) BHB‐lysine, (c) acetylated p300, (d) acetylated p53, (e) SIRT1, (f) phosphorylated AMPKthr172, (g) total oxidative phosphorylation, (h) SOD2, (i) IRE1, BiP, CHOP, and phosphorylated eIF2α, (j) KAT1, (k) KAT3, and (l) KAT4 levels. (m) Representative images for all Western blot data are shown. CD, control and KD, ketogenic diet animals. *p < 0.05, **p < 0.01. All values are presented as mean ± SEM (n = 8).
