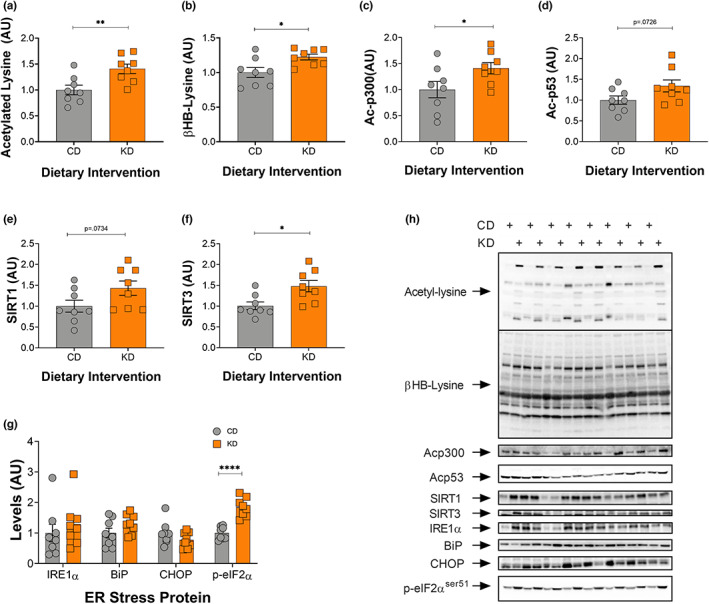
FIGURE 3.

Acetylation and BHBylation increase in response to a 2‐month KD in gastrocnemius muscle. (a) Acetylated lysine, (b) BHB‐lysine, (c) acetylated p300, (d) acetylated p53, (e) SIRT1, (f) SIRT3, and (g) IRE1, BiP, CHOP, and phosphorylated eIF2α levels in the GTN muscle following 2 months on a KD. (h) Representative images for all graphs. CD, control and KD, ketogenic diet animals. *indicates p < 0.05, **p < 0.01, ***p < 0.001, ****p < 0.0001. All values are presented as mean SEM (n = 8).
