
FIGURE 5.
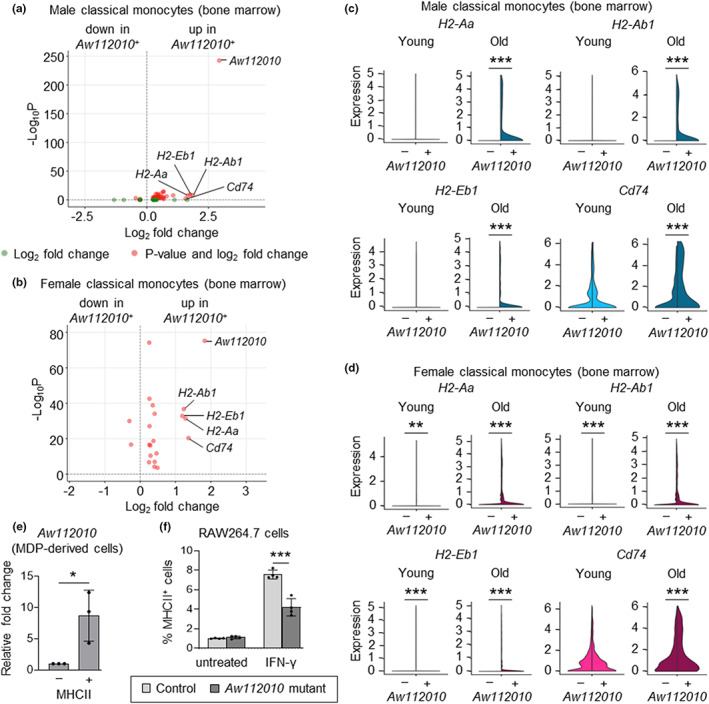
Aw112010 regulates MHCII expression by mouse macrophages. (a, b) Volcano plots show DEGs between classical monocytes (young and old combined) expressing and lacking Aw112010 (Aw112010 + and Aw112010 −, respectively) in male (a) and female (b) mice. Genes with Log2 fold change ≥1 are labeled. (c, d) Violin plots show the expression of H2 genes and Cd74 by classical monocytes expressing and lacking Aw112010 (Aw112010 + and Aw112010 −, respectively) in young and old, male (c) and female (d) mice. (e) qRT‐PCR measurement of Aw112010 expression in FACS‐sorted MHCII+ and MHCII− cells from 7‐day GM‐CSF cultures of young mouse bone marrow MDPs (see Figure S9E for gating). Data are presented as mean plus standard deviation of three replicates of MDP cultures derived from cells pooled from five mice. (f) Control and Aw112010 mutant RAW264.7 cells were treated with IFN‐γ (10 ng/ml) for 24 h and MHCII expression was assessed by flow cytometry (see Figure S9F for gating strategy). Data are presented as mean plus standard deviation of four replicates of RAW264.7 cell cultures, which are representative of three independent experiments. Statistical significance (c–f) was assessed by two‐tailed Student's t‐test (*p < 0.05, **p < 0.01, ***p < 0.001).