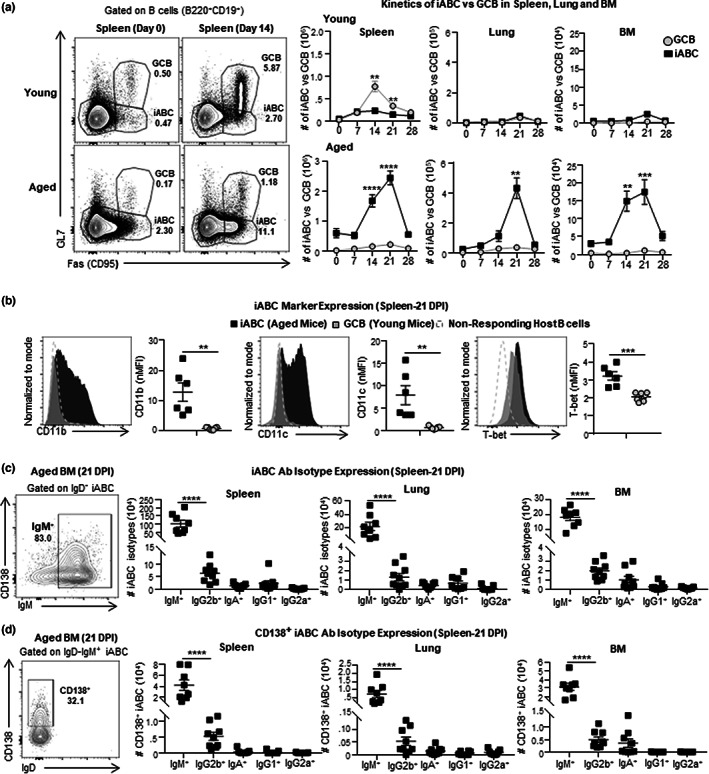
FIGURE 1.

Kinetics of aged B cell effectors and Ab response. (a) Experimental Design: Aged (18–20 M) and young (3–4 M) B6 mice, were infected i.n. with 0.3 LD50 (25 PFU) PR8 (IAV) and sacrificed at 0, 7, 14, 21, and 28 dpi for analysis of B cell responses in the spleen, lungs and bone marrow (BM) by flow cytometry. Representative FACS plots indicate responding B cells by Fas and GL7 expression cells (left) and the kinetics of iABC(Fas+GL7−) versus GCB(Fas+GL7+) response is expressed as total cell numbers per organ in the spleen, lung and BM of young and aged mice. (b) Representative histograms and normalized MFI showing CD11c, CD11b, and T‐bet expression in iABC in aged mice (black) versus GCB in young mice (grey) response in the spleen. (c) Representative FACS plots and total numbers of IgM+, IgG2b+, IgA+, IgG1+, and IgG2a+iABC in spleen, lung and BM at 21 dpi. (d) Representative FACS plots and total numbers of IgM+CD138+, IgG2b+CD138+, IgA+CD138+, IgG1+CD138+, and IgG2a+CD138+iABC in spleen, lung and BM at 21 dpi (n=6–12 pooled from 2 to 3 separate experiments) Error bars represent SEM. Statistical significance determined by two‐tailed, unpaired Student's t‐test; *p < 0.05; **p < 0.01; ***p < 0.001, ****p < 0.0001
