
FIGURE 2.
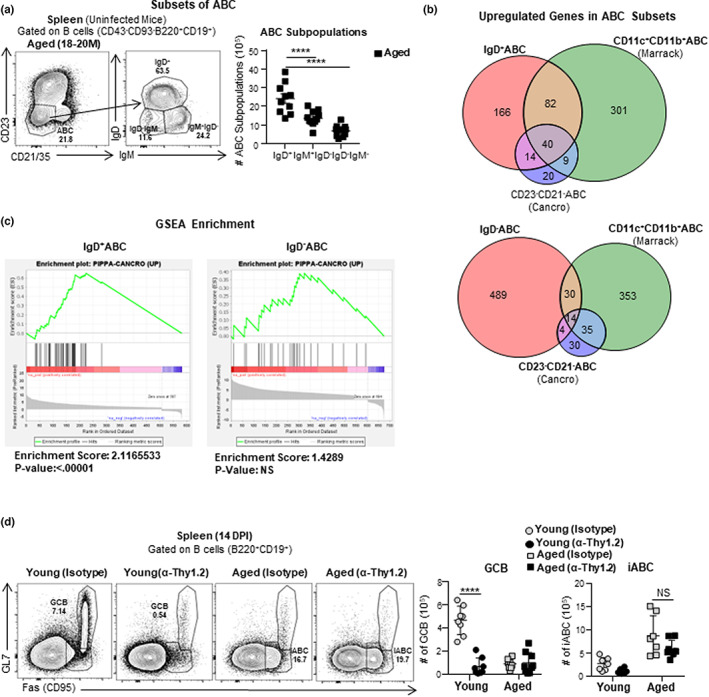
Age‐associated B cells (ABC) subsets and iABC develop independently of T cells. (a) Experimental Design: Uninfected Aged (18–20 M) and young (3–4 M) female B6 mice were sacrificed. CD23−CD21−ABC subsets in the spleen were analyzed by flow cytometry. Representative FACS plot of gated ABC (CD43−CD93−B220+CD19+CD23−CD21−) (left) and the number IgD+, IgM+IgD− and IgD−IgM− ABC (right) (n = 9–12 pooled from 5 to 6 separate experiments) (b, c) Experimental Design: Uninfected Aged (18–20 M) female B6 mice were sacrificed, Spleens were harvested, IgD+CD23−CD21−ABC, IgD−CD23−CD21−ABC and IgD+CD23+CD21−FOB were FACS sorted for RNA sequencing. (b) Venn diagrams showing the fraction of expressed genes shared between IgD+ABC and published ABC genes reported by Marrack (Rubtsov et al., 2011) and Cancro (Russell Knode et al., 2017) (top) and the same analysis with IgD−ABC (bottom). (c) GSEA plots assessing enrichment of ABC signature genes that are upregulated in sorted IgD+ (top) versus IgD− (bottom) ABC (n = 2 pooled from 2 separate experiments). (d) Experimental Design: Aged (18–20 M) and young (3–4 M) female B6 mice were treated with anti‐Thy1.2 or isotype control Ab on 0 DPI and 7 DPI, infected with 0.3LD50 (25 PFU) PR8 (IAV) and sacrificed at 14 dpi. Spleens were harvested and analyzed for iABC and GCB by flow cytometry. Representative FACS plots and cell numbers of iABC (Fas+GL7−) and GCB Fas+GL7+ gated on mature B cells (B220+CD19+) in anti‐Thy1.2 or isotype control Ab treated aged and young mice in the spleen (n = 8–10 pooled from 2 to 3 separate experiments). Error bars represent SEM and statistical significance determined by two‐tailed, unpaired Student's t‐test; *p < 0.05; **p < 0.01; ***p < 0.001, ****p < 0.0001.