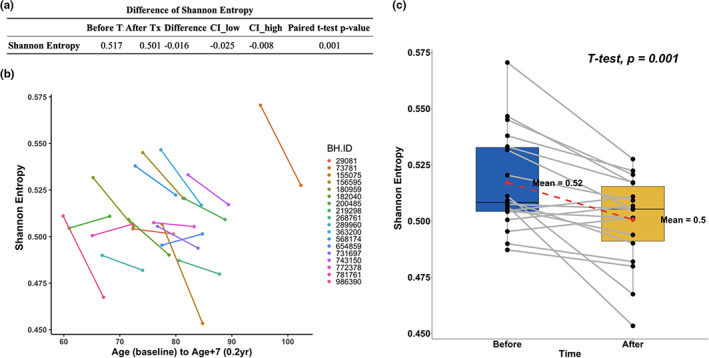
FIGURE 3.

Changes in methylation entropy. (a) Results of the paired t‐test. (b) Spaghetti plots. Age after treatment is represented by artificially calculating 7 additional years for better visualization. (c) Paired boxplot. The y‐axis shows the Shannon entropy level. Uncorrected two‐sided p‐value was calculated with a paired Student's t‐test.
