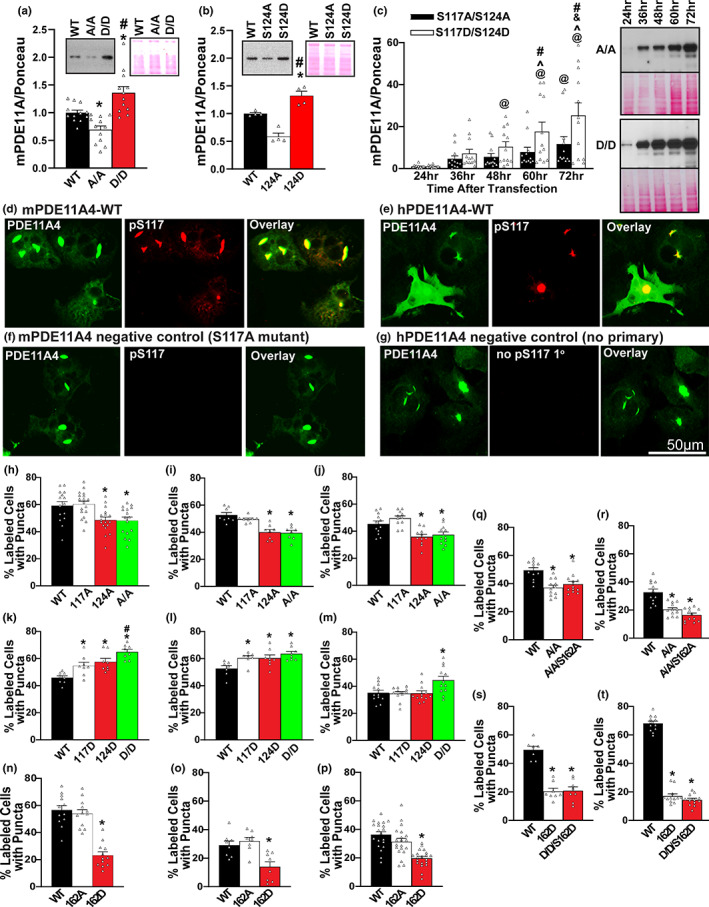
FIGURE 4.

Phosphorylation of serine 117 (S117) and serine 124 (S124), but not serine 162 (S162), are sufficient to increase PDE11A4 expression and drive the accumulation of PDE11A4. Previous studies suggested PDE11A4 regulates its own protein expression levels (Hegde, Ji, et al., 2016; Smith et al., 2021). As such we determined if the increased phosphorylation of PDE11A4 at S117 and S124 observed in the aged hippocampus (Figure 1) was sufficient to cause age‐related increases in PDE11A4 protein expression and accumulation. To do so we tested the effect of phospho‐resistant (alanine, A) versus phosphomimic (aspartate, D) mutations. (a) in 2 experiments using HT‐22 cells harvested 24 h following transfection (combined data shown here), preventing phosphorylation at S117/S124 (A/A) decreased PDE11A4 protein expression while mimicking phosphorylation (D/D) increased protein expression relative to wild‐type (WT; n = 12 biological replicates/group; F[2,33] = 17.03, p < 0.001; post hoc: WT vs. A/A p = 0.011, WT vs. D/D p = 0.004, A/A vs. D/D p < 0.001. (b) This pattern was replicated in HT‐22 cells when preventing vs. mimicking phosphorylation only at S124 (S124A vs S124D, respectively; n = 4 biological replicates/group; F[2,9] = 35.94, p < 0.001; post hoc: WT vs. S124A p = 0.001, WT vs. S124D p = 0.005, S124A vs. S124D p < 0.001). (c) COS1 cells were then harvested 24–72 h following transfection and expression levels for each mutant were normalized to their own 24‐h baseline in order to determine if the differential expression noted 24 h following transfection would escalate over time. Indeed, across 2 experiments (combined data shown) the difference in expression between S117A/S124A (A/A) vs. S117D/S124D (D/D) continues to grow over time (n = 12 biological replicates/mutant/time; effect of mutation × time: F[4,44] = 4.89, p = 0.002; post hoc A/A 60 h vs D/D 60 h p = 0.003, A/A 72 h vs D/D 72 h p < 0.001), with D/D showing significant increases in expression over its own 24 h baseline as early as 48 hours following transfection (post hoc, D/D 24 h vs D/D 48 h p = 0.013) but A/A not showing a significant increase in expression over its own 24‐h baseline until 72 h after transfection (A/A 24 h vs A/A 72 h p = 0.011). (d) Immunocytochemistry of transfected COS1 cells with an antibody that recognizes PDE11A4‐pS117 on both mouse PDE11A4 (mPDE11A4) and (e) human PDE11A4 (hPDE11A4) shows PDE11A4‐pS117 is enriched in the accumulated pools of PDE11A4. The lack of pS117 signal in (f) the phosphoresistant mutant (S117A) and the (g) no primary antibody conditions argues the pS117 signal observed is specific. Next, we determined if preventing/mimicking phosphorylation at S117 and S124 would be sufficient to reduce/increase trafficking of mPDE11A4 into puncta. Although S117A alone had no effect, both S124A and S117A/S124A reduced the presence of PDE11A4‐filled puncta in (h) COS‐1 cells (n = 15–18 biological replicates/group; F[3,62] = 7.02, p < 0.001; post hoc vs WT: S124A p = 0.004, S117A/S124A p = 0.01), (i) HEK293T cells (n = 8 biological replicates/group; F[3,28] = 16.45, p < 0.001; post hoc: WT vs. S124A and S117A/S124A, p < 0.001), and (j) HT‐22 cells (n = 11–12 biological replicates/group; F[3,42] = 10.78, p < 0.001; post hoc vs. WT: S124A p = 0.004, S117A/S124A p = 0.005). In contrast, S117D and S124D alone or in combination increased the presence of PDE11A4‐filled puncta in (k) COS‐1 cells (n = 8 biological replicates/group; F[3,28] = 13.17, p < 0.001; post hoc vs. WT: S117D p = 0.008, S124D p = 0.002, S117D/S124D p < 0.001; post hoc vs. S117D/S124D: S117D p = 0.007, S124D p = 0.023), (l) HEK293T cells (n = 7–8 biological replicates/group; F[3,26] = 5.29, p = 0.006; post hoc vs WT: S117D p = 0.033, S124D p = 0.012, S117D/S124D p = 0.004), and (m) HT‐22 cells (n = 12 biological replicates/group; F[3,44] = 5.39, p = 0.003; post hoc vs S117D/S124D: WT p = 0.003, S117D p = 0.008, S124D p = 0.005). The ability of phosphorylation to increase the accumulation of PDE11A4 appears to be selective for S117 and S124 in that a phosphomimic mutation at S162 (S162D) reduces the accumulation of PDE11A4 in puncta in (n) COS‐1 cells (n =12 biological replicates/group; F[2,33] = 38.72, p < 0.001; post hoc: WT vs. S162D, p < 0.001), (o) HEK293T cells (n = 8 biological replicates/group; F[2,21] = 10.05, p < 0.001; post hoc: WT vs. S162D, p < 0.001) and (p) HT‐22 cells (n = 20 biological replicates/group; F[2,57] = 18.46, p < 0.001; post hoc: WT vs. S162D, p < 0.001). The ability of S117A/S124A to reduce the presence of PDE11A4‐filled puncta does not require phosphorylation of S162 in (q) COS‐1 cells, (n = 12 biological replicates/group; F[2,33] = 12.63, p < 0.001; post hoc: WT vs. S117A/S124A/S162A, p < 0.001) or (r) HT‐22 cells (n = 12 biological replicates/group; F[2,33] = 22.89, p < 0.001; post hoc: WT vs. S117A/S124A/S162A, p < 0.001). In contrast, phosphomimic mutation at S162 is able to prevent S117D/S124D‐induced accumulation of PDE11A4 in (s) COS‐1 cells (7–8 biological replicates/group; F[2,20] = 44.10, p < 0.001; post hoc: S162D vs. S117D/S124D/S162D p = 0.885) and (t) HT‐22 cells (n = 12 biological replicates/group; F[2,33] = 447.17, p < 0.001; post hoc: S162D vs. S117D/S124D/S162D p = 0.201). *vs. WT, p = 0.011–<0.001; #vs. other mutant(s), p = 0.023– <0.001; @greater than 24 h, p = 0.011– <0.001; ^greater than 48 h, p = 0.026– <0.001; &greater than 60 h, p = 0.019. Data plotted as individual data points and mean ± SEM. Histogram stretch, brightness, and/or contrast of images adjusted for graphical clarity
