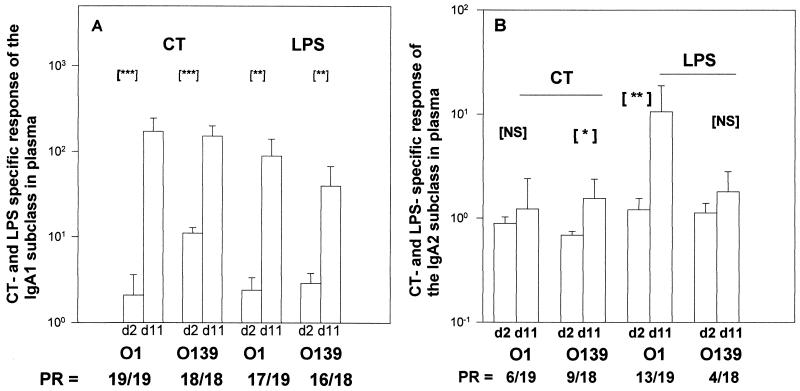
FIG. 2.
CT- and LPS-specific antibody responses, in plasma, of the IgA1 (A) and the IgA2 (B) subclasses in V. cholerae O1- and V. cholerae O139-infected patients. The GMT and SEM are shown. Asterisks indicate statistically significant differences in the responses between the acute stage (day [d] 2) and at convalescence (day 11): ∗, P < 0.05 to 0.01; ∗∗, P < 0.01 to 0.001; ∗∗∗, P < 0.001. PR, number of patients showing positive response/total number of patients studied.

