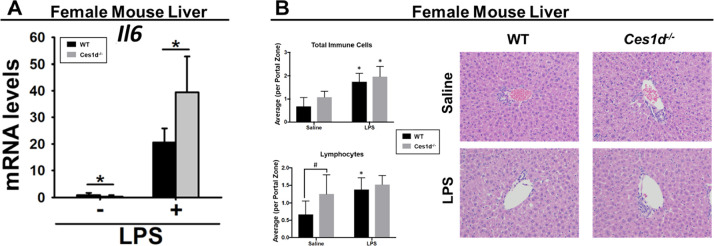
Figure 7.
LPS-induced Il6 mRNA levels were enhanced in female Ces1d−/− mouse liver compared to WT mouse liver at 6 h following intraperitoneal LPS challenge (A). Hematoxylin and eosin (H&E) histology and immune cell quantification of female WT and Ces1d−/− mouse livers 6 h following LPS challenge (B). Representative H&E-stained images from each treatment group are shown. Total immune cells were quantified within 4 layers of hepatocytes surrounding 20 portal zones from each mouse. The average number of cells per portal zone is represented in the bar graphs. Immune cells were further distinguished by cell type, and the lymphocyte numbers are shown. Data are expressed as mean ± SD (n = 5–6 mice/group). Two-way ANOVA assessed significant differences between groups. In panel A, *p < 0.05, comparisons are indicated. In panel B, #p < 0.05, comparison is indicated; *p < 0.05 for LPS vs saline.

