Figure 2.
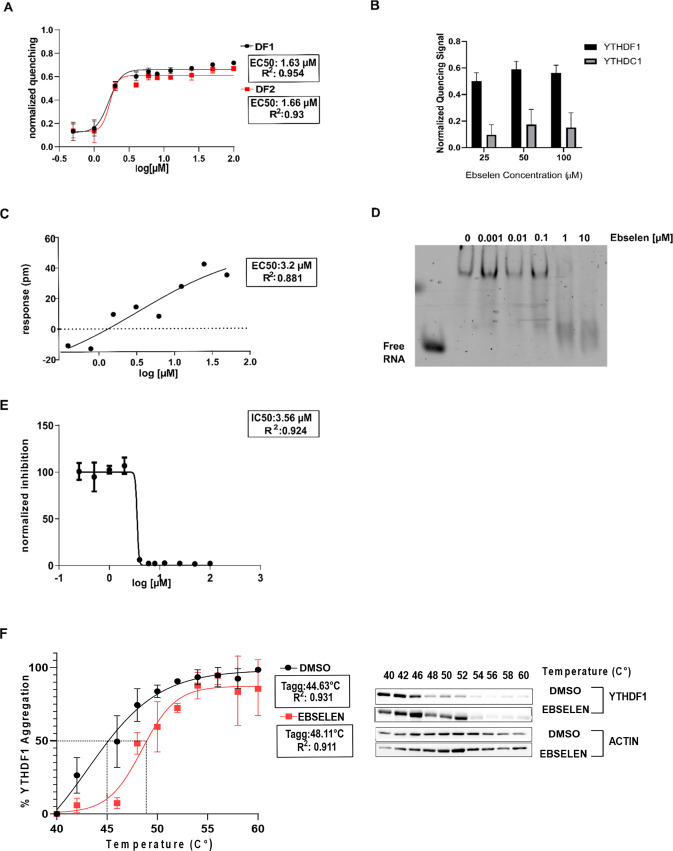
Organoselenium compound ebselen is an inhibitor of the YTH domain and can bind YTHDF1 in cells. (A) Dose–response curves of increasing amounts of ebselen added to the YTHDF1 and YTHDF2 protein domains were obtained with the tryptophan quenching assay. Data were fitted with a four-parameter nonlinear regression model, R2 = 0.954 and 0.93, EC50 of 1.63 and 1.66 μM for the YTHDF1 and YTHDF2 YTH domains, respectively. (B) Ebselen cannot reduce tryptophan fluorescence of the YTH domain of the YTHDC1 protein. (C) Dynamic mass redistribution (DMR) assay to evaluate ebselen binding at equilibrium. Measurements were performed before (baseline) and after (final) compound addition. The response (in picometers (pm)) was measured by subtracting the baseline output from the final output signals. The output signal for each well was obtained by subtracting the signal of the protein-coated reference area from the signal of the uncoated area. The data were fitted to a sigmoidal function using a four-parameter logistic (4PL) nonlinear regression model: R2 = 0.8147, EC50 = 3.22 μM. (D) REMSA shows the inhibitory effect of the candidate drug ebselen on the RNA-binding activity of the YTH domain of YTHDF1, starting from 1 μM. (E) Determination of the IC50 value of the ebselen molecule with the AlphaScreen assay, using nonlinear regression fits of the data according to a four-parameter nonlinear regression model: R2 = 0.9844, IC50 = 3.565 ± 0.009 μM. (F) Tagg curves and cellular thermal shift assay (CETSA) Western blots for YTHDF1 in HEK293T cells in the presence of DMSO and 50 μM ebselen. Ebselen causes a shift of 4 °C in the Tagg of YTHDF1 in HEK293T cells. The CETSA data are expressed as mean ± SD (n = 3 independent assays); relative band intensities were fitted using a sigmoidal (variable slope) curve fit. Tagg values are determined where there is 50% of YTHDF1 aggregation. DMSO: R2 = 0.9416, Tagg = 44.63 °C ± 2. Ebselen: R2 = 0.9113, Tagg = 48.11 °C ± 1.36 (ΔTagg = 3.48 °C, **p = 0.0044, two-way analysis of variance (ANOVA)).

