Figure 1—

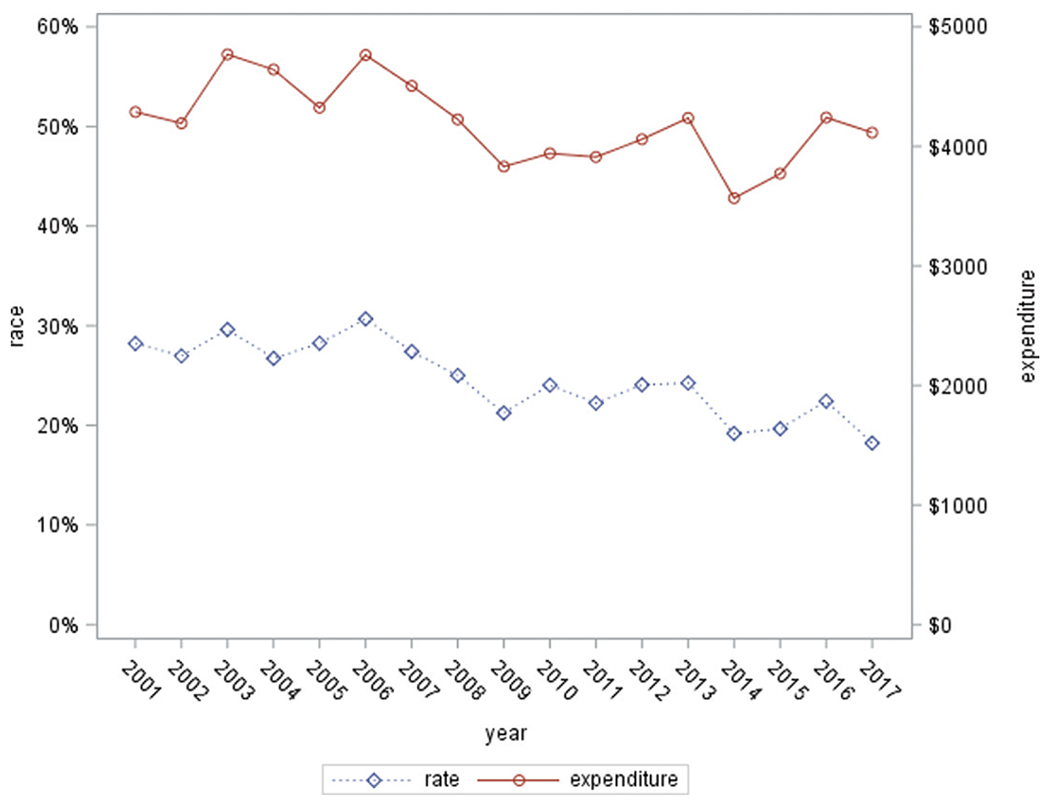
Total OOP costs and high OOP cost rate among U.S. adults with diagnosed diabetes, 2001–2017. High OOP cost rate: percentage of patients living in a family of OOP cost >10% of family income.

Total OOP costs and high OOP cost rate among U.S. adults with diagnosed diabetes, 2001–2017. High OOP cost rate: percentage of patients living in a family of OOP cost >10% of family income.