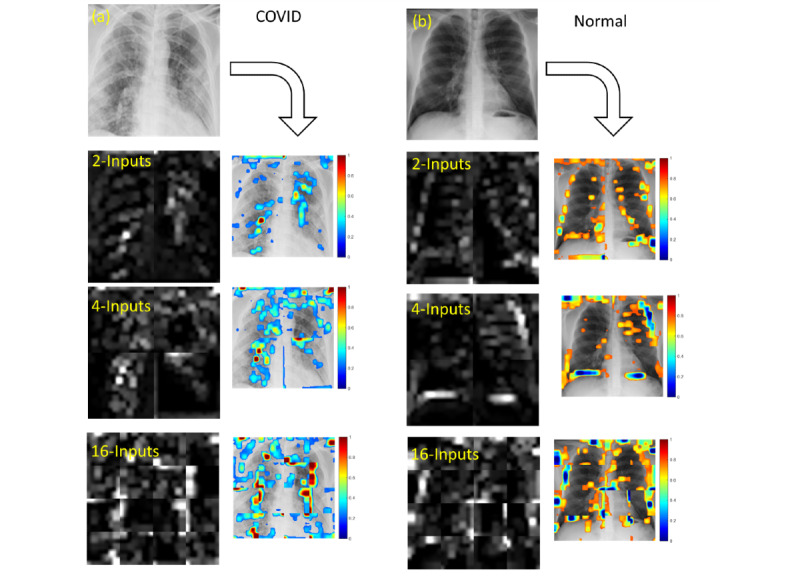
Figure 13.

Visualization and mapping of convolutional neural network (CNN) features extracted from the strongest activations of the max-pooling layers using multiple-input CNNs with different numbers of inputs and the left- and right-lung region of interest data sets. (a) CNN features of COVID-19 chest X-ray radiographs (CXRs); (b) CNN features of normal CXRs. In color mapping, the red regions indicate COVID-19 features and the blue regions indicate normal features.
