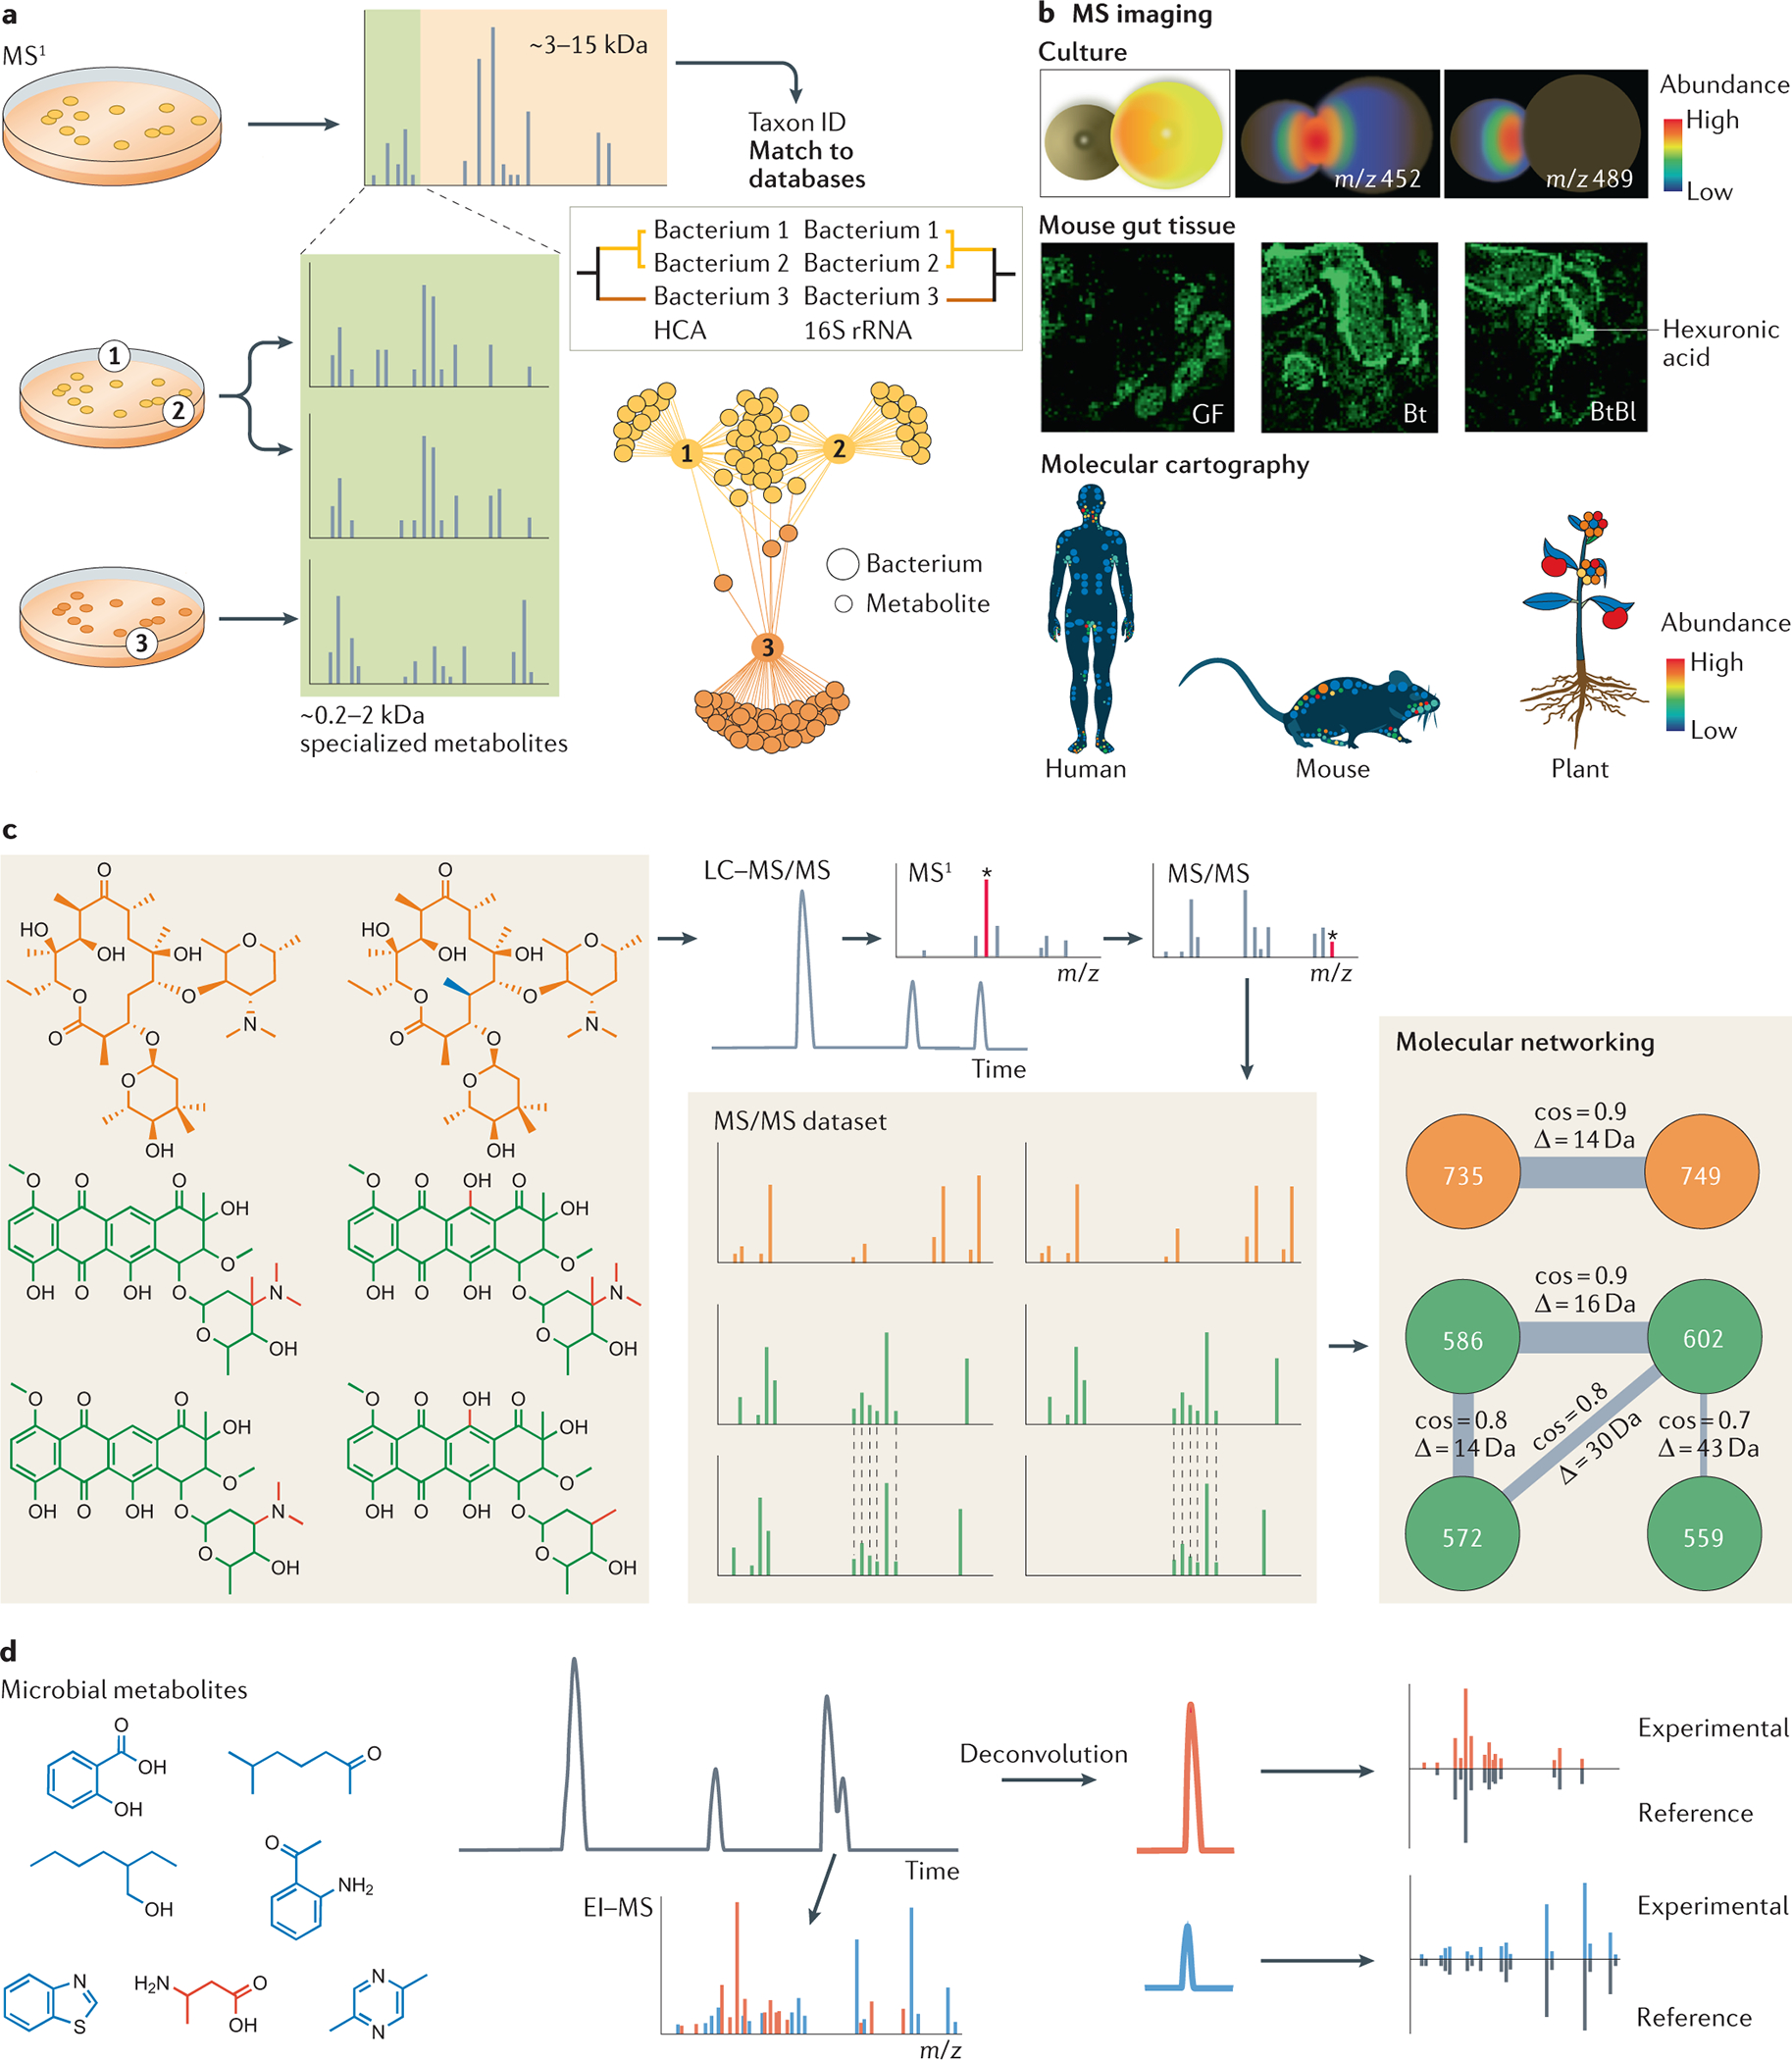
Fig. 1: Mass spectrometry metabolomics approaches for studying the microbiome.

a) MS1 acquired by matrix-assisted laser desorption-ionization mass spectrometry (MALDI-MS) enables bacterial taxon identification. The range of ribosomal proteins (3–15 kDa) is used to search for a match in spectral libraries, and the hierarchical clustering generated with these data strongly correlates with 16S rRNA. The range between 0,2–2 kDa shows specialized metabolites (molecular association network)31, 32. b) Illustrative examples of imaging MS. Interactions between microorganisms can be observed by co-culture experiments (top panel). Spatial distribution of hexuronic acid in the gut of different mice can be investigated (middle panel). The examples shown are from germ-free (GT) mice, mice mono-colonized with Bacteroides thetaiotaomicron (Bt), and mice bi-colonized with Bt and Bifidobacterium longum (Bl). and molecular cartography can reveal the 3D distribution of specific ions in humans, mice and plants (bottom panel). c) Microbial metabolites can be analyzed by liquid chromatography–tandem MS (LC-MS/MS)156. The precursor mass is selected in MS1 to be fragmented, generating the MS/MS spectra. Thousands of MS/MS spectra are generated in an untargeted analysis, which can be organized by molecular networking by spectral similarities. Spectral similarity is represented by cosine score (cos), the higher the cosine the higher the similarity. D is the mass difference between two nodes (precursor ions) d) Microbial small metabolites analyzed by electron ionization (EI-MS). Deconvolution is essential to separate spectra from co-eluting compounds. The spectra can be searched for a match in spectral libraries to annotate known compounds. Images in part b adapted from Ref 36.
