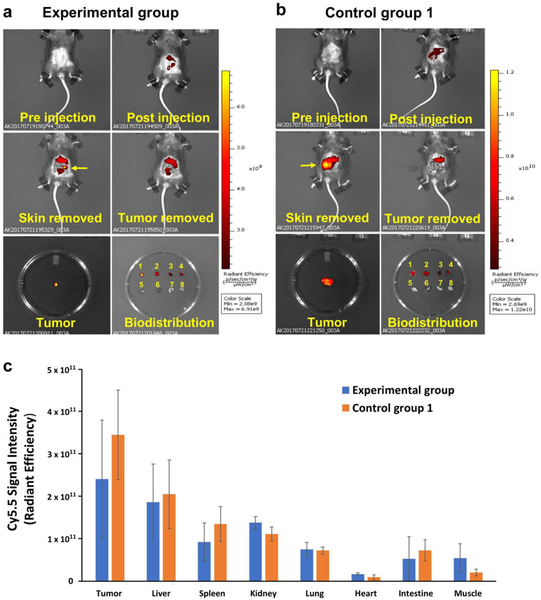
Fig. 2.
In vivo optical imaging after 4 rounds of chemotherapy with 5-FU. There were visible differences in fluorescence intensity of Cy5.5 in tumors between a the experimental and b non-treated control animals. Note the disappearance of the optical signal from the tumor upon tissue removal signifying the specificity of MN-EPPT. Tissue labels in Petri dish: 1 ‒ tumor, 2 ‒ liver, 3 ‒ spleen, 4 ‒ kidney, 5 ‒ lung, 6 ‒ heart, 7 ‒ intestine, 8 – muscle. c Biodistribution showed lower uptake of MN-EPPT in experimental treated animals consistent with uMUC1 downregulation. Note that there was no statistical differences in the uptake by major organs between experimental and non-treated control group.

