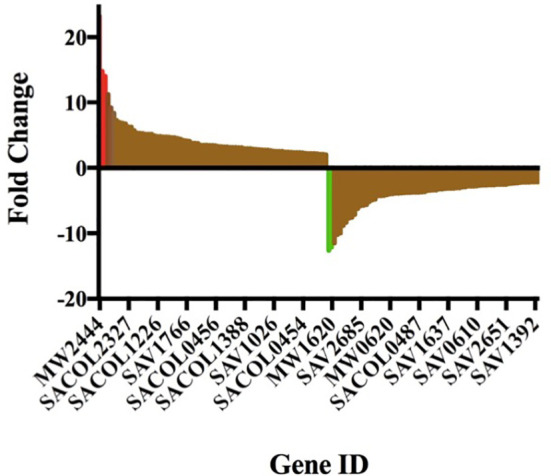
Figure 4.

Gurmarin affects expression of Sa genes. Differentially expressed genes at 2-fold change is visualized in Prism 7 program. The upregulated and downregulated genes, including a few highly induced (red) and highly repressed genes (green), are shown. For gene details and fold changes, see Tables 1 and 2 .
