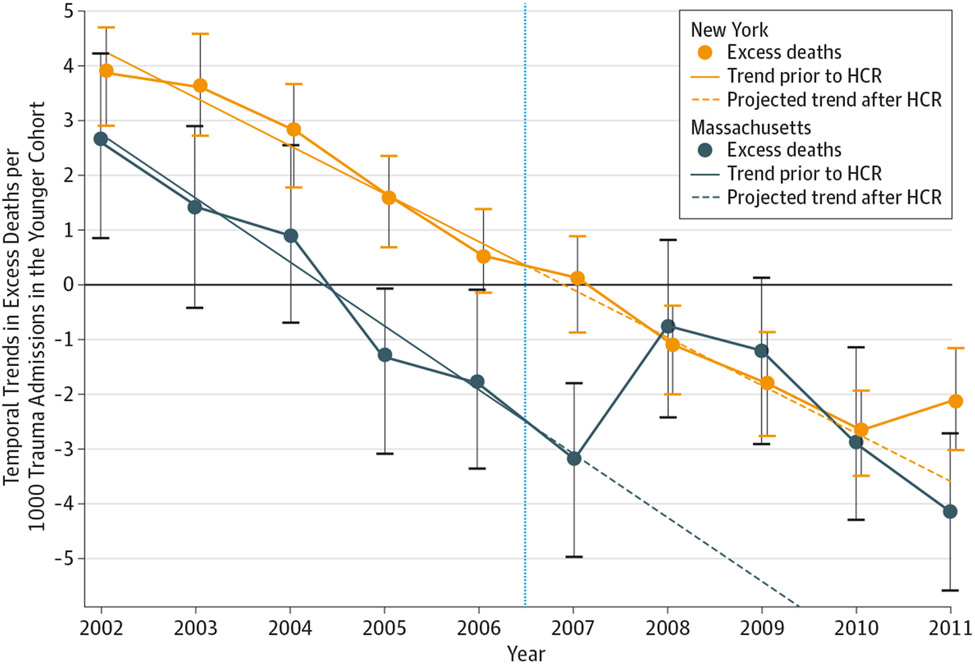
Figure 2. Temporal Trends in Excess Deaths per 1000 Trauma Admissions in the Younger Cohort.
In New York, the number of excess trauma deaths per 1000 admissions gradually decreased over time, while in Massachusetts, an increase in excess trauma deaths per 1000 admissions followed the introduction of health care reform and continued for 3 years. The vertical blue line indicates the introduction of health care reform in 2006; error bars, 95% CIs. Separate trend lines have been superimposed on excess deaths per 1000 admissions for Massachusetts and New York in the period prior to the introduction of health care reform and extrapolated into the 5 years following health care reform. The horizontal line at 0 divides more excess deaths from fewer excess deaths.

