FIG 1.
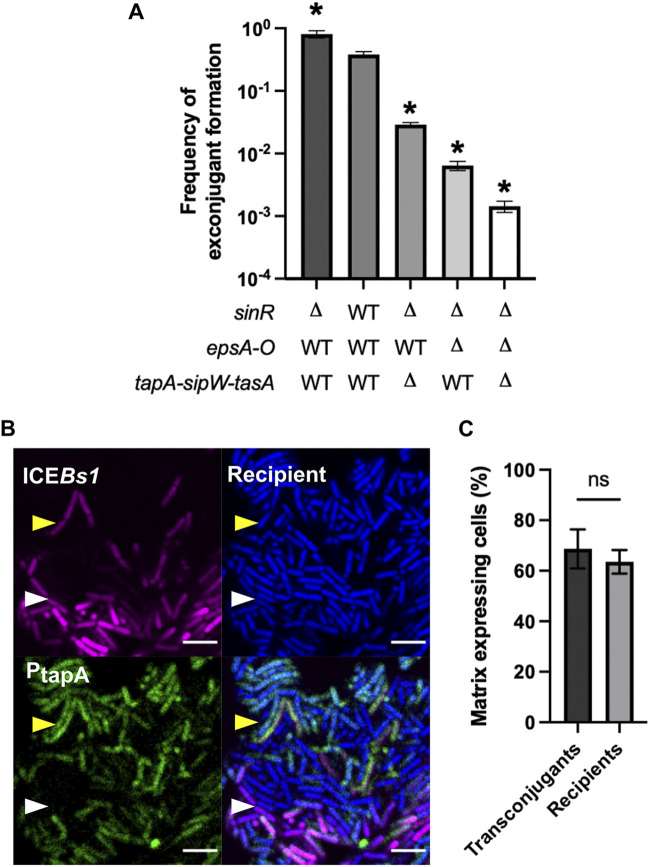
Influence of matrix production on ICEBs1 acquisition. (A) Mating between wild-type (WT) donor bacteria and recipient bacteria affected in their ability to produce biofilm matrix, incubated for 20 h on solid MSgg. The error bars represent the standard deviation of the mean (SD), and the results are representative of 3 biological replicates. Statistical analysis was done using a Brown-Forsythe and Welch’s analysis of variance (ANOVA) followed by Dunnett’s multiple-comparisons test. *, significant difference (P ≤ 0.05) from the WT. (B) Mating between donor cells carrying ICEBs1-mkate2 (magenta) and recipient cells expressing cfp (blue) at a 1:5 donor-to-recipient ratio. Cells were incubated for 20 h on MSgg before imaging. Both donor and recipient also possess the PtapA-yfp (green) biofilm reporter. The scale bar indicates a size of 5 μm. The white arrow shows a transconjugant that does not produce matrix, and the yellow arrow shows a transconjugant-producing matrix. The image is representative of more than 20 pictures of conjugative clusters from 3 independent biological replicates. (C) Proportion of transconjugant and recipient cells expressing matrix gene, as determined by enumeration of 9 conjugative clusters using microscopy images. Statistical analysis was done using paired t test; ns, P > 0.05. Error bars represent the SD, and the results are representative of 3 independent replicates.

