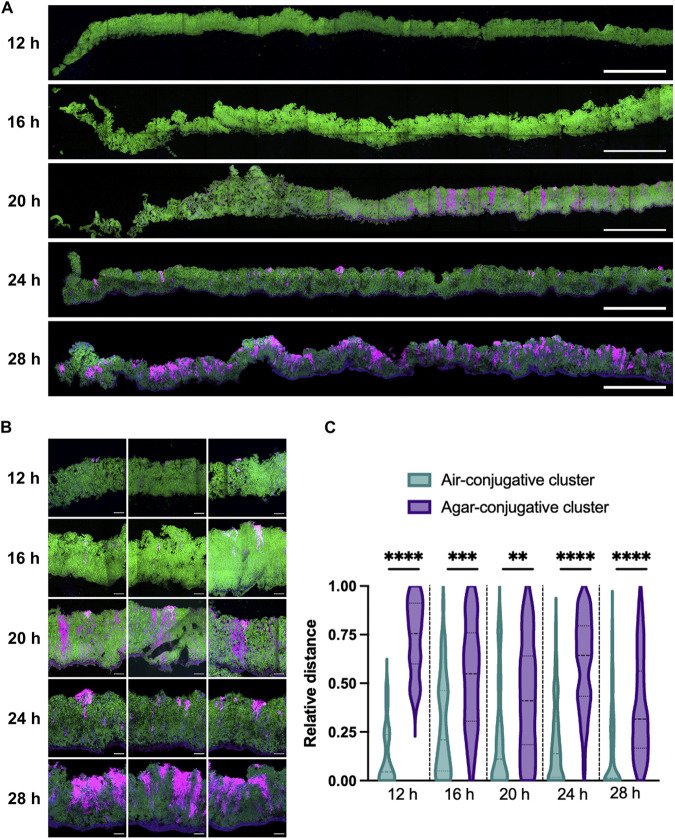
FIG 3.
Spatiotemporal analysis of ICEBs1 propagation within a biofilm. Vertical thin section of biofilm composed of donor cells expressing ICEBs1-mkate2 with recipient cells expressing a gfp gene at a 1:5 donor-to-recipient ratio. At the indicated time, biofilms were fixed prior to cryosectioning. (A) Wide view of the thin section representing approximately one-third of the biofilm diameter, starting from the edge (left) toward center (right). (B) Closeup of the conjugative clusters. Donors appear purple, recipients are shown in green, and transconjugants are in light pink to gray color; for each image, the air-biofilm interface is at the top, and the biofilm-agar interface is at the bottom. The scale bars indicate a size of 250 μm (A) and 20 μm (B). (C) Relative distance of the conjugative cluster from the air-biofilm (light green) or agar-biofilm (purple) interface. Relative distance is reported as the distance separating the conjugative cluster to the interface relative to the depth of the biofilm at the cluster’s location. The darker dotted lines represent the median, and lighter dotted lines represent the 25th and 75th percentiles. Results are a compilation of at least 19 conjugative clusters from at least 3 independent biofilms. Statistical analysis was done using a t test and shows that the bacterial cluster is closer to the air-biofilm interface than the agar-biofilm interface. (**, P < 0.01; ***, P < 0.001; ****, P < 0.0001).

