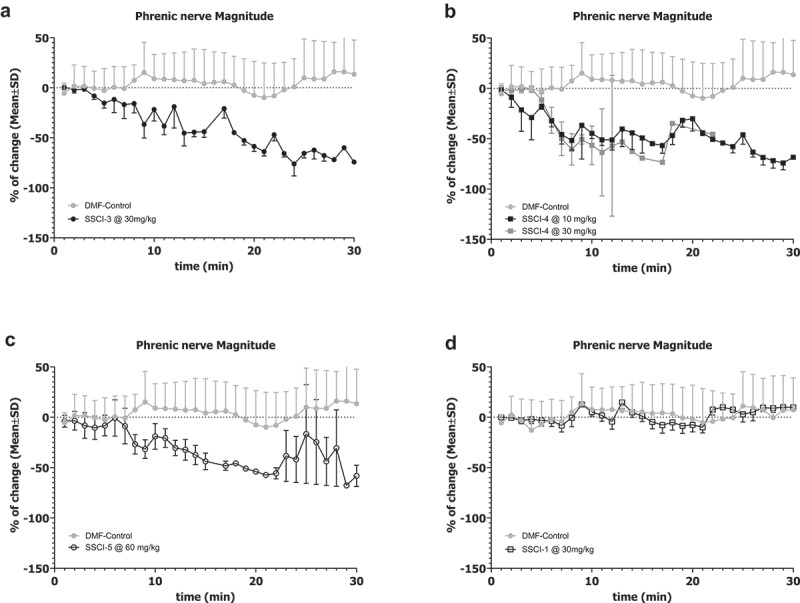
Figure 5.

Effects of NaV1.6 Inhibitors on Rat Phrenic Nerve Activity.
Changes in the magnitude of phrenic nerve electrical activity were measured for each SSCI as described in the Methods. Each panel depicts the change in average magnitude from the vehicle baseline as a function of time. The gray symbols in each panel are from vehicle (DMF) animals, while the black symbols are from compound treated animals. Error bars represent SEM and are unidirectional for clarity. Compound infusion started at time 0; a stable recording in vehicle had been obtained as a baseline prior to compound infusion and is not represented here. SSCI-3 (A, solid black symbols), SSCI-4 (B, closed black squares), and SSCI-5 (C, open black circles) all demonstrated a greater than 50% depression of phrenic nerve activity magnitude. SSCI-1 (D, open black squares) did not demonstrate any significant change in phrenic nerve activity magnitude over the course of the experiment.
