
Figure 6.
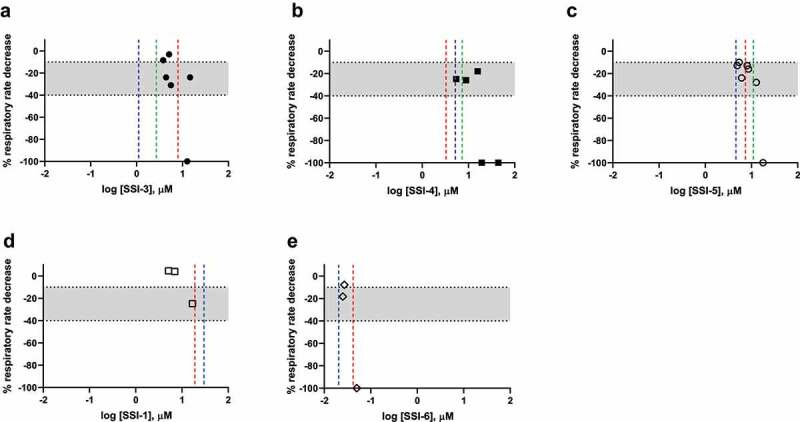
Effect of NaV1.7 Inhibitors on Rat Respiratory Rate (blue = human NaV1.6 IC50; red = rat NaV1.6 IC50, green = HMD IC50).
Each panel represents the % respiratory rate decrease (Y-axis) in the rat CVR assay as a function of free plasma exposure (X-axis) for each SSCI. The dashed lines in each panel represent the in vitro potency for human NaV1.6 (blue), rat NaV1.6 (red), or the ex vivo potency in the rat HMD assay (green). The shaded area on each graph demarks respiratory rate decrease from −10 to −40%. SSCI-1 (D) and SSCI-6 (E) do not have a reported HMD IC50 value because the compounds either did not achieve 50% inhibition (SSCI-1) or all concentrations produced supramaximal inhibition (SSCI-6) in the assay. A % respiratory decrease of 100% also indicates animal mortality in the assay.