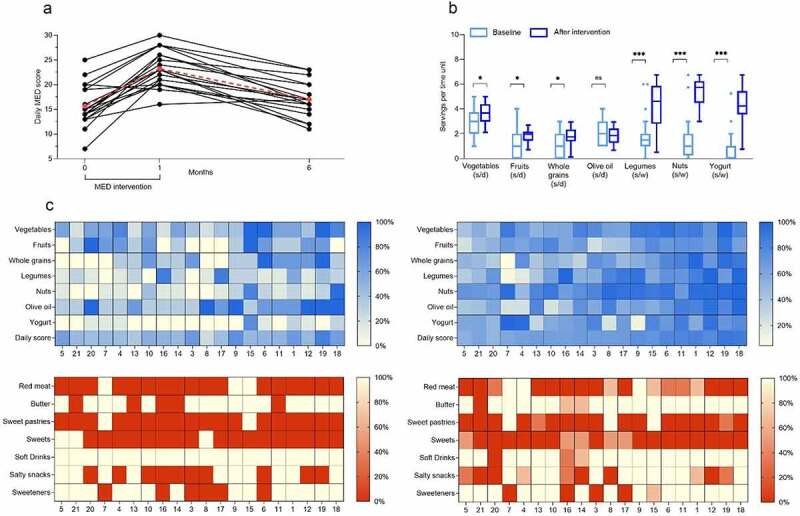
Figure 1.

Adherence to Mediterranean diet (MED) based on daily and weekly questionnaires. A: (a) Daily MED score over time based on self-reported daily questionnaire. B: Baseline and average throughout the intervention consumption of each recommended MED component; (s/d: servings per day; s/w: servings per week) C: Heatmaps of individual nutritional data at baseline (left) and during the intervention (right). Each row represents a food component, and each column represents an individual. The intensity of the colors reflects the adherence to MED based on the recommendation in terms of number of servings per day.
