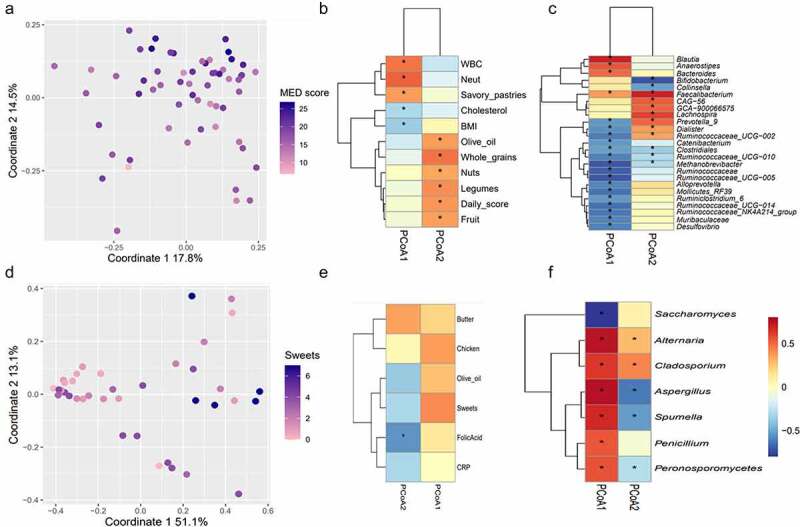
Figure 3.

Factors affecting the bacterial and eukaryotic microbiomes. A: PCoA (Bray-Curtis); each point represents a single sample and is colored by the corresponding daily MED score. B-C: Spearman’s correlations between the coordinates of each of the first two PCoA axes and clinical/dietary variables (b) or relative abundance of bacterial genera (c). D-F: Same as A-C, for eukaryotic microbiome; points in (d) are colored by sweets consumption. Criterions for feature inclusion in heatmaps were:(B) q < 0.2 and R>[0.3|; (e) p < .05 and R>|0.3|; (c,f) q < 0.2 and R>[0.5|. For all panels, correlations with q values <0.2 are marked by asterisks.
