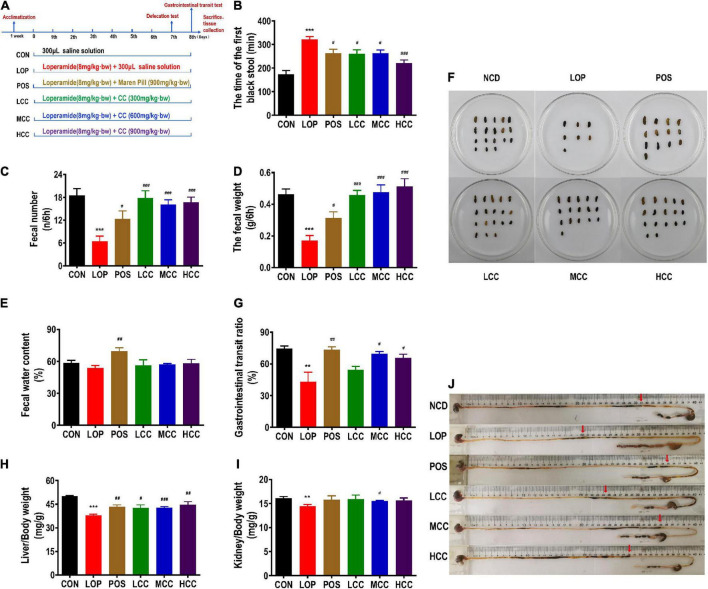
FIGURE 1.
Influences of CCAE on loperamide-induced constipation symptoms in mice. (A) Grouping and basic workflow of animal experiment. (B) The defecation time of the first black stool, FBS. (C) Number of feces excreted in 6 h, FN. (D) Wet weight of feces excreted in 6 h, FW. (E) Fecal water content. (F) Representative fecal morphology of each group. (G) Gastrointestinal transit rate, GTR. (H) Liver index. (I) Kidney index. (J) Ink advancing distance and intestinal length. The data are expressed as the means ± SEMs (n = 10-12). *, Compared with the CON group; #, compared with the LOP group. **P < 0.01, ***P < 0.001. #P < 0.05, ##P < 0.01, ###P < 0.001.

