FIGURE 5.
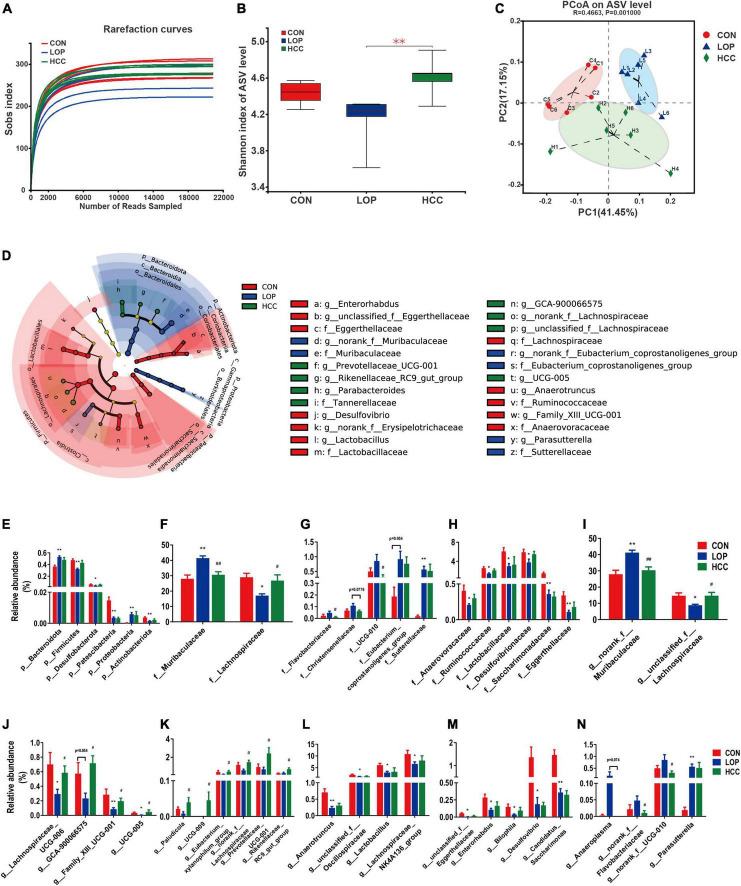
HCC restores the LOP-induced gut microbial community structural and compositional shift. (A) The rarefaction curve of the Sobs index of each sample plateau at the ASV level. (B) Alpha diversity estimated by the Shannon index. (C) PCoA (principal coordinate analysis) plot based on weighted UniFrac distance. (D) Linear discriminant analysis effect size (LEfSe) analyses (LDA score of > 2.0). (E–N) Relative abundances of gut microbiota at the phylum, family, and genus levels, which were significantly affected by LOP or HCC, especially those reversed by HCC treatment. The data are expressed as the means ± SEMs (n = 6). *, Compared with the CON group; #, compared with the LOP group. *P < 0.05, **P < 0.01. #P < 0.05, ##P < 0.01.

