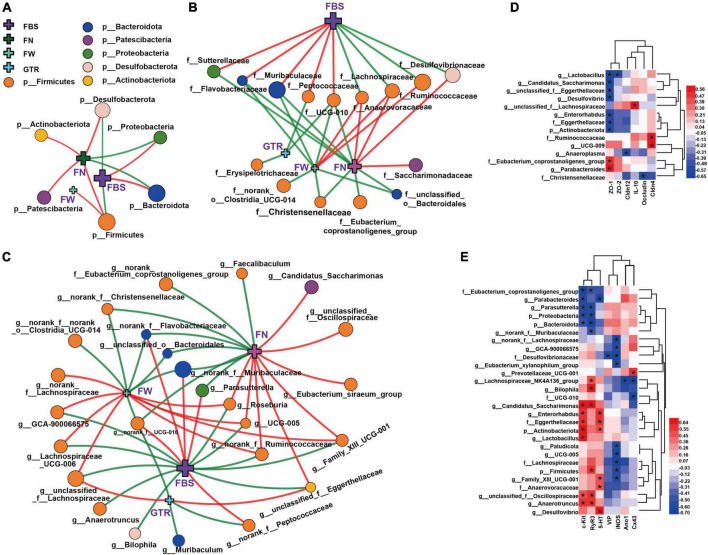
FIGURE 6.
Network and heatmaps showing correlations between specific gut bacteria and core host parameters in STC mice. (A–C) Two-factor correlation network analysis (P < 0.05; Spearman, n = 6 in each group). Red lines represent r values ≥ 0.4, and green lines represent r values ≤ 0.4. Correlations between gut bacteria and the laxative phenotypic indicators, including (A) at the phylum level, (B) at the family level, and (C) at the genus level. FBS, the defecation time of the first black stool; the wet weight of the feces (FW) and the number of feces excreted in 6 h (FN); the gastrointestinal transit rate (GTR). (D,E) Bivariate correlations (P < 0.05, n = 6 in each group), including correlations between gut bacteria and intestinal inflammation, gut barrier function in the colon of mice (D), correlations between gut bacteria and serum neurotransmitters, gastrointestinal motility factors (E). IL-10, ZO-1, ZO-2, Cldn4, Cldn12, Occludin, c-Kit, SCF, Ano1, and Cx43 indicate their mRNA expression levels in the colons of mice. 5-HT, iNOS, and VIP indicate their expression levels in serum. The color at each intersection indicates the value of the r coefficient; P -alues were adjusted for multiple testing according to the Bonferroni and Hochberg procedures. * Indicates a significant correlation between these two parameters.

