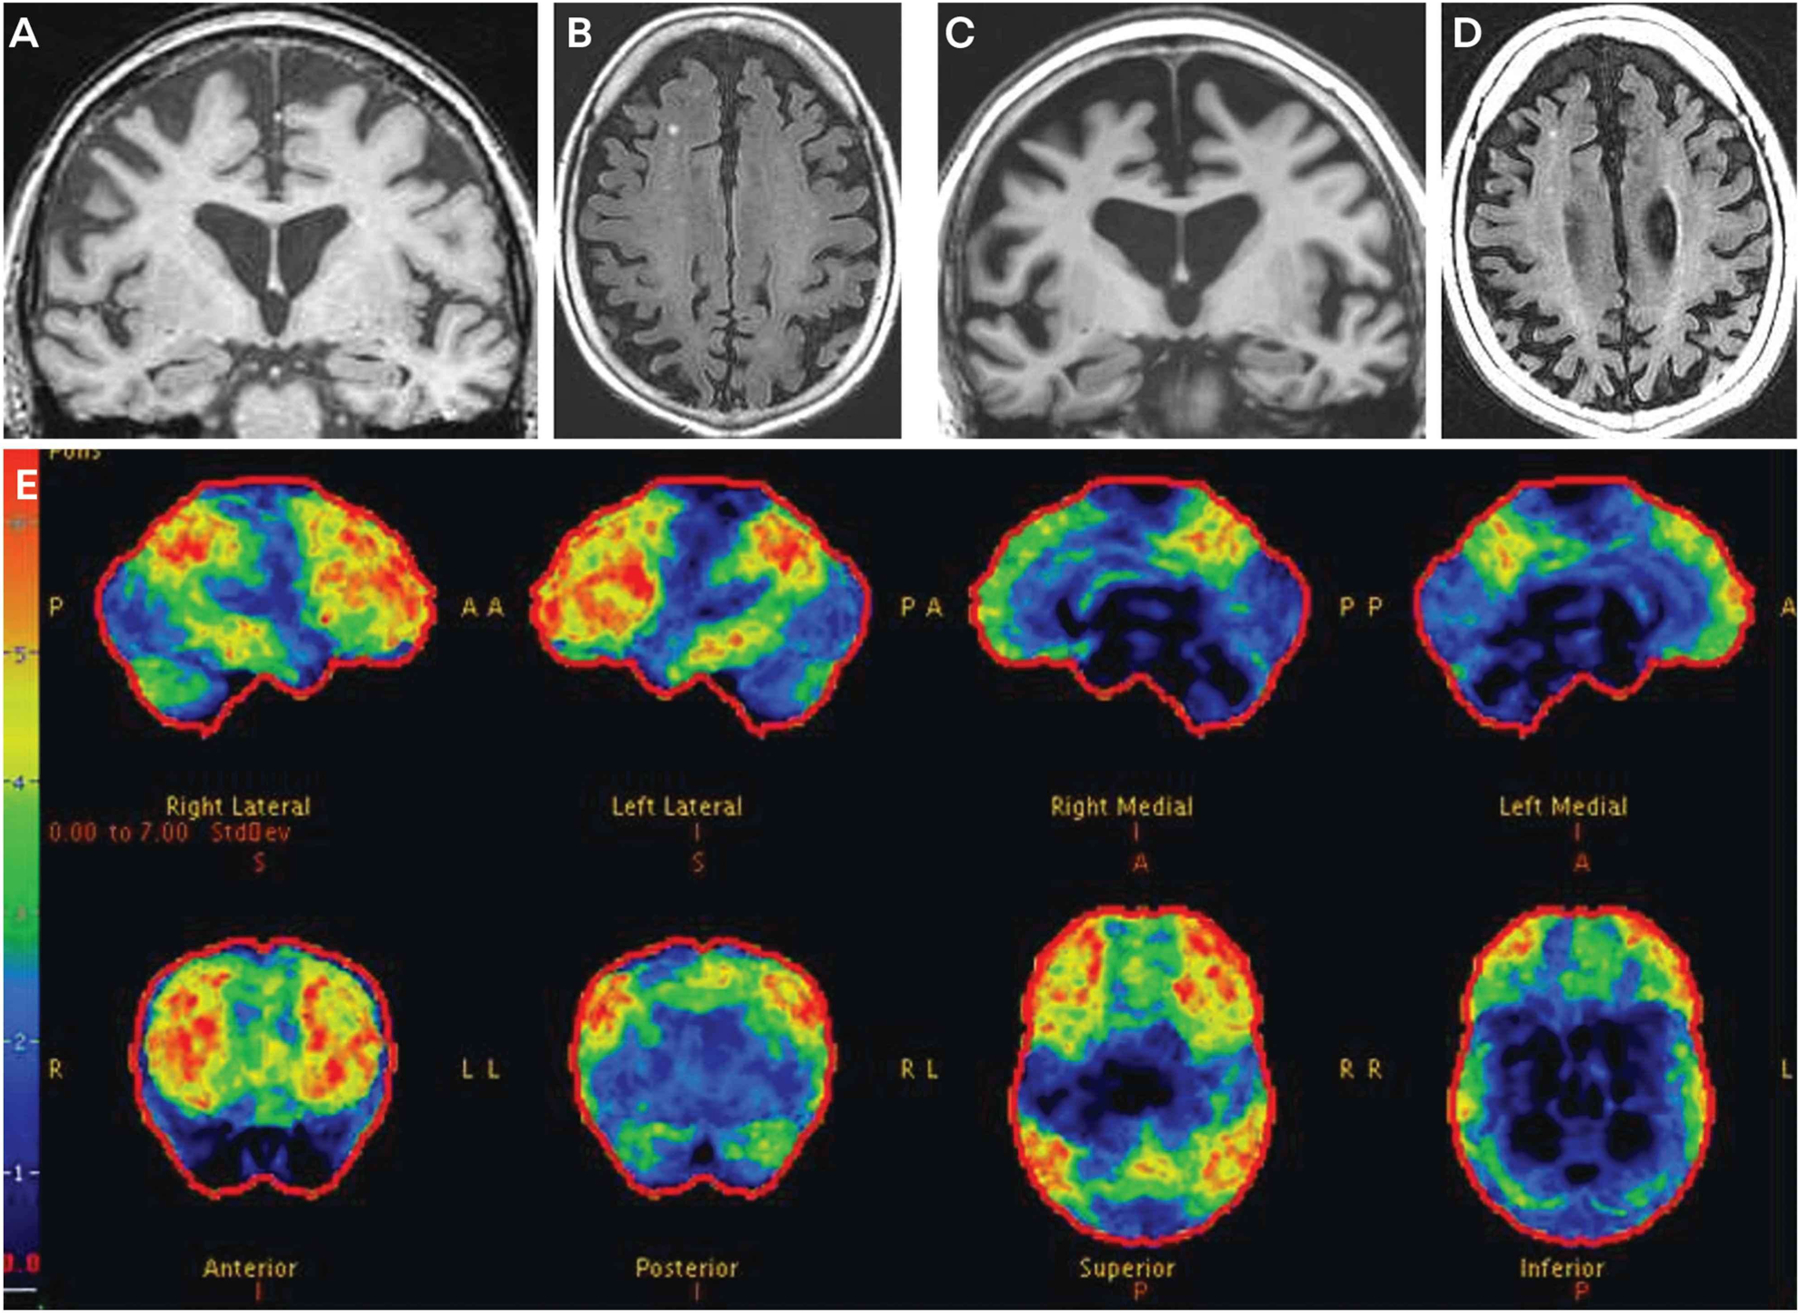
FIGURE 3–1.

Imaging of the patient in CASE 3-1. Coronal T1-weighted (A) and axial fluid-attenuated inversion recovery (FLAIR) (B) MRI at age 58 show frontal more than parietal atrophy, but minimal hippocampal atrophy. Coronal T1-weighted (C) and axial FLAIR (D) MRI at age 62 show progression of the frontal and parietal atrophy and only minimal hippocampal atrophy. Fludeoxyglucose positron emission tomography (FDG-PET) (E) at age 58 shows marked hypometabolism in the frontal regions, with slightly less prominent hypometabolism in the temporal and parietal regions and the posterior cingulate region. The color bar and z score reference on the far left of the FDG-PET image reflects the degree of FDG hypometabolism, with blue reflecting z scores in the −1 to −2 range and red reflecting a z score of −6. Therefore, the regions with gray or black color reflect normal metabolism, blue color reflects slight to mild hypometabolism, and green to yellow to red color reflects moderate to very severe hypometabolism.
