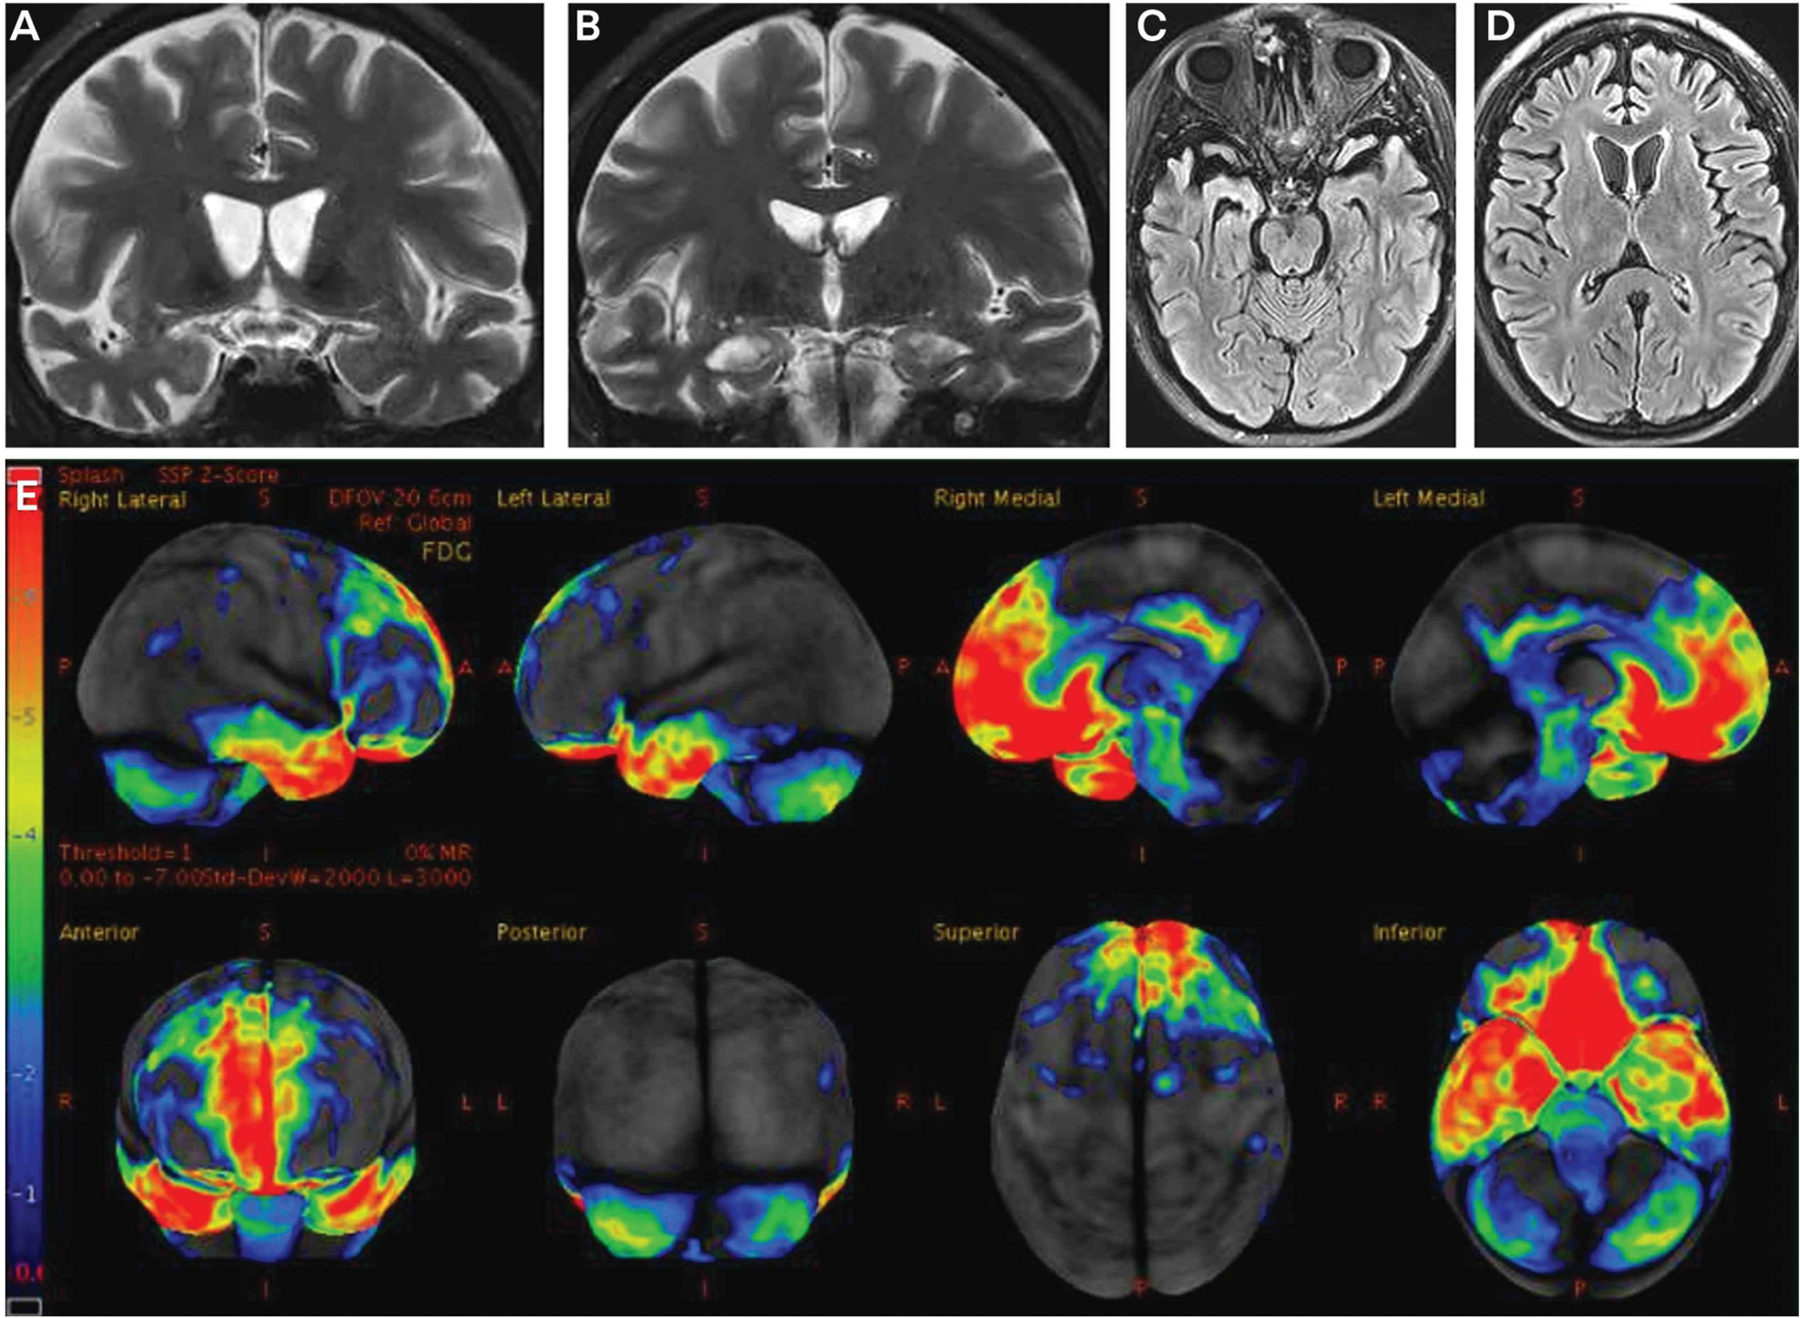
FIGURE 3–4.

Imaging of the patient in CASE 3-4. Coronal (A, B) T2-weighted and axial (C, D) fluid-attenuated inversion recovery (FLAIR) MRI slices show frontal and temporal atrophy as well as thinning of the caudate heads. Fludeoxyglucose positron emission tomography (FDG-PET) (E) shows hypometabolism in the frontal and temporal regions that is most pronounced in the mesial frontal, orbitofrontal, and anterior temporal regions. The color bar andz score reference on the far left of the FDG-PET image reflect the degree of FDG hypometabolism, with blue reflecting z scores in the −1 to −2 range and red reflecting a z score of −6. Therefore, the regions with gray or black color reflect normal metabolism, blue color reflects slight to mild hypometabolism, and green to yellow to red color reflects moderate to very severe hypometabolism.
