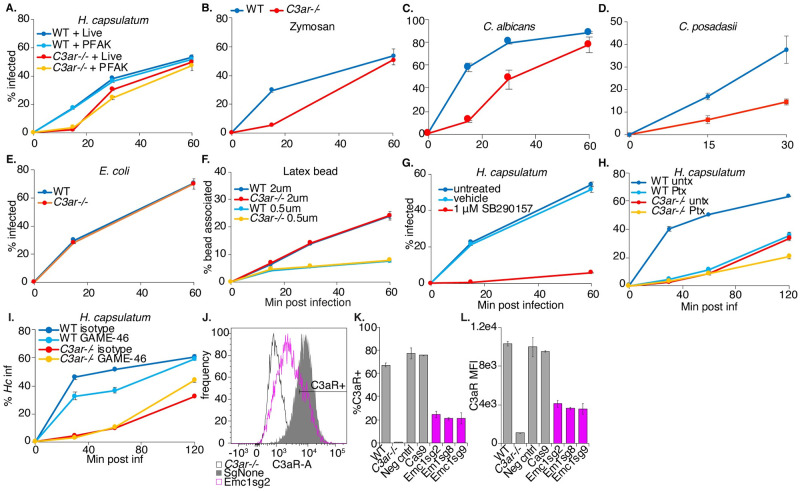
Fig 3. C3aR signaling plays a role in macrophage phagocytosis of fungi.
A. WT and C3ar-/- BMDMs were infected with live and PFA-killed mCherry-expressing Hc yeast (MOI2), and the phagocytosis rate was monitored over-time using flow-cytometry (n = 3 biological replicates). B. WT and C3ar-/- BMDMs were infected with FITC-labelled zymosan or mCherry-expressing Hc (MOI2) and the phagocytosis rate infected cells was monitored using flow cytometry (n = 3 biological replicates). C. BMDMs were infected with Candida albicans (Ca) (MOI3). Cells were imaged using confocal microscopy to quantify phagocytosis (n = 2 biological replicates, >350 cells/replicate). CFW staining was used to exclude extracellular Ca. D. BMDMs were infected with FITC-labelled Coccidioides posadasii (Cp) arthroconidia (MOI1), and extracellular conidia were labelled with calcofluor white. BMDM infection rates were determined using confocal microscopy (n = 3 biological replicates, 200–400 cells/rep). E. BMDMs were infected with FITC-labelled E. coli bioparticles (MOI4) and the E. coli-association with BMDMs was monitored via flow cytometry (n = 2 biological replicates). F. BMDMs were infected with 2 μm or 0.5 μm red fluorescent latex beads (MOI2), and the rate of BMDM association with the beads was measured using flow cytometry (n = 3 biological replicates). G. BMDMs were treated with a C3aR antagonist (1 μM SB290157) and infected with Hc yeast (MOI2). Phagocytosis was measured using flow cytometry (n = 3 biological replicates). H. BMDMs were pre-treated for 2 h with 1 μg/mL pertussis toxin (Ptx), which inhibits Gαi, and infected with Hc (MOI5, n = 3 biological replicates). I. BMDMs were pre-treated for 90 min with 10 μg/mL CD18 blocking antibody (GAME-46) and infected with Hc yeast (MOI5, n = 3 biological replicates) Phagocytosis was measured using flow cytometry. Emc1 is required for C3aR expression in BMDMs (J-L). J. Emc1 CRISPRKO BMDMs and control sgRNA transduced BMDMs, and C3aR levels were measured via flow cytometry following C3aR surface staining (n = 2 biological replicates). K. Histogram of C3aR levels in control and Emc1 CRISPRKO BMDMs. L. Frequency of C3aR+ cells in the indicated BMDMs. M. The mean fluorescence intensity (MFI) of the C3aR signal in the indicated BMDMs.

