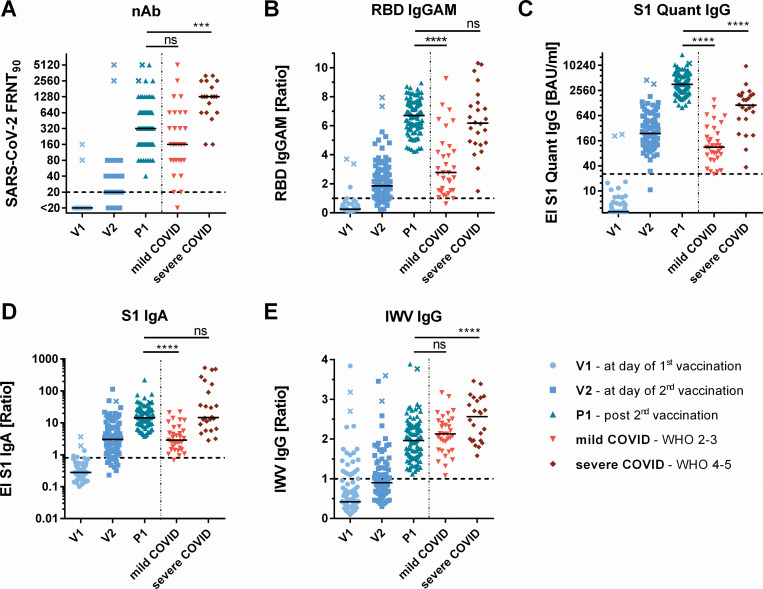
Fig 2. BNT162b2 vaccination induced antibodies in comparison to SARS-CoV-2 infection induced antibodies The presented data shows antibody ratios before first (V1), 3 weeks after first (V2), and 2 weeks after second vaccination (P1), as well as antibodies in sera of patients after mild and severe COVID-19 course.
(A) Reciprocal titers of SARS-CoV-2 neutralizing antibodies were measured in focus reduction neutralization assay with 90% inhibition (FRNT90). (B) RBD IgGAM signals determined as sample/cut-off ratios (C) S1 quant IgG antibodies were quantitatively measured in binding antibody units per milliliter (BAU/ml). (D-E) S1-IgA and inactivated SARS-CoV-2 whole virus IgG signals (IWV) were determined as sample/calibrator ratios. The horizontal dotted lines represent positivity cut-offs. * = p<0.05, ** = p<0.01, *** = p<0.001, **** = p<0.0001, ns = not significant. x-marked data points represent vaccinees with a previous SARS-CoV-2 infection.

