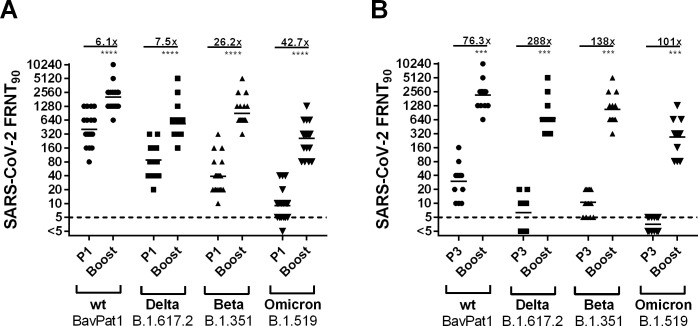
Fig 6.
SARS-CoV-2 nAb titers on the wildtype strain wt-BavPat1 and the VOC strains Delta, Beta and Omicron after third vaccination (Boost) (A) compared to P1 two weeks after second vaccination and (B) compared to P3 8 months after first and third vaccination (Boost). Only individuals that had provided samples at both time points were compared. The dotted line indicates the limit-of-detection at a titer of 1:5. FRNT90: Focus reduction neutralization titer at 90% virus inhibition; results plotted as reciprocal values. Mean neutralizing titer reductions are depicted above the continuous lines * = p<0.05, ** = p<0.01, *** = p<0.001, **** = p<0.0001, ns = not significant.

