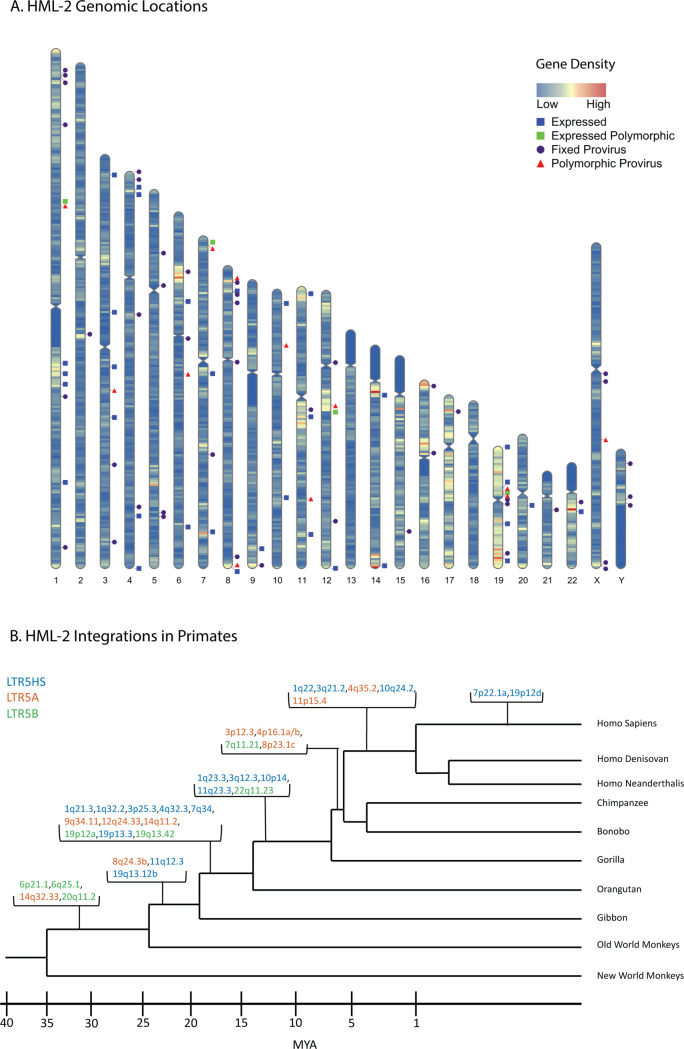
Fig 1. HERV-K HML-2 proviruses vary in chromosomal location and age of integration.
(A) Human chromosome map showing gene density and location of 2-LTR proviruses in the genome. Purple circles represent proviruses that are fixed in the human population; red triangles represent known polymorphic proviruses; blue squares represent GTEx-expressed (TPM ≥1) proviruses. Note that the expression status of polymorphic proviruses could not be determined. Gene density is represented in a heatmap of low = blue to high = red. Prepared using RIdeogram [70]. (B) Primate phylogeny illustrating the ESA of HML-2 proviruses expressed in the GTEx dataset at a TPM of ≥1. As in this and subsequent figures, provirus color (blue, red, green) corresponds to LTR subtype (LTR5HS, LTR5A, and LTR 5B, respectively). The ESA groups for each provirus listed in 1B are presented in S1 Table. These ESA groups were determined by Subramanian and colleagues [8]. ESA, earliest shared ancestor; GTEx, Genotype Tissue and Expression; HERV, human endogenous retrovirus; HML, human mouse mammary tumor virus-like; LTR, long terminal repeat; MYA, million years ago; TPM, transcripts per million.

