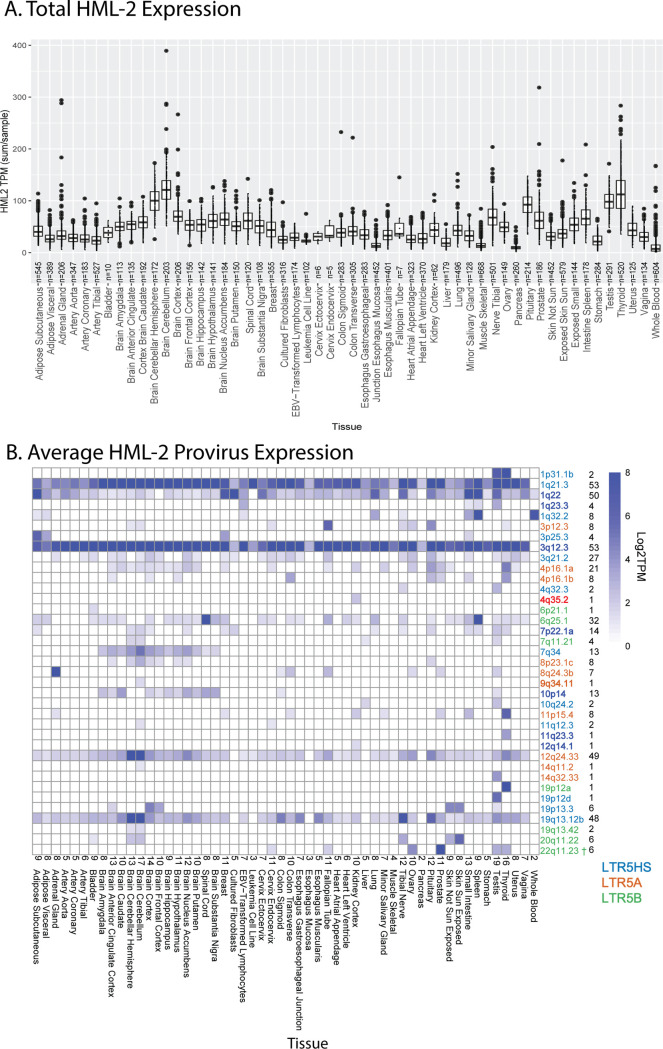
Fig 3. HML-2 expression in GTEx.
(A) Combined expression of all HML-2 proviruses per individual sample per body site. The box and whisker plots show the mean as a line in the middle of a box bounded by the first and third quartile values, with the whiskers extending to 1.5 times the IQR and with outlier values shown as individual dots. All proviruses with an average expression less than 1 TPM are excluded. (B) Overall expression in log2 TPM for HML-2 proviruses expressed at ≥1 TPM is displayed for each body site. The specific proviruses, color coded by LTR type as in Fig 2, are shown on the right, followed by the number of tissues where each provirus was expressed. The number of proviruses in each tissue is displayed above the tissues on the horizontal axis. LTR-driven proviruses are in boldface. † denotes the provirus 22q11.23, which is driven by a separate upstream 5HS LTR and was therefore not bolded in this figure. TPM counts used to generate each figure can be found in S1 Data with each body site included as an individual sheet. GTEx, Genotype Tissue and Expression; HML, human mouse mammary tumor virus-like; IQR, interquartile range; LTR, long terminal repeat; TPM, transcripts per million.

