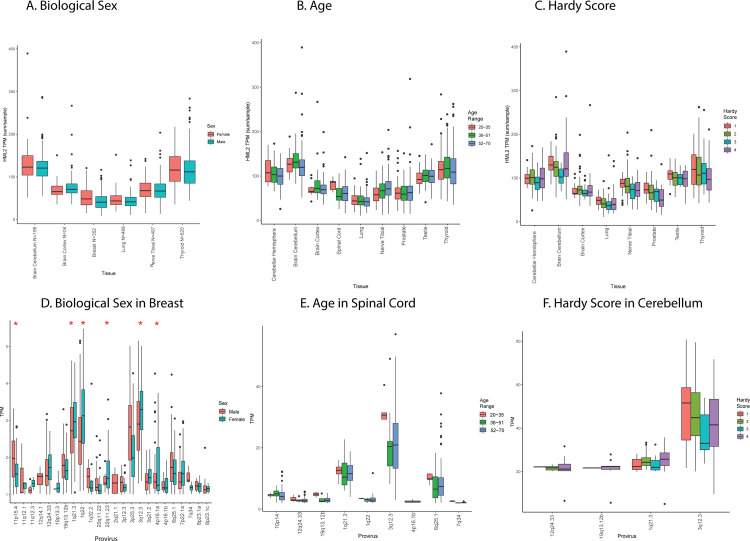
Fig 7. Effects of covariates and morbidities on HML-2 expression.
(A, B, C) Average TPM per tissue of interest of total HML-2 expression for donors separated by biological sex, age, and Hardy score plotted as in Fig 3A. Biological sex was identified by Y chromosome expression: Age was divided into 3 groups (20–35, 35–51, and 52–70); Hardy score is broken down into 4 categories. 1 is the fastest death; 4 is the slowest. (D, E, F) Expression of individual proviruses in the indicated body sites (breast, spinal cord, and cerebellum). Average TPM of all proviruses expressed greater than or equal to a TPM of 1 is displayed from all samples of each body site. Red asterisks indicate statistically significant (p < 0.5) differences (t test). All TPM data are from the relevant sheets of S1 Data. Covariate information for each donor can be found in S1 Data on the SUBJID_Pheno sheet. HML, human mouse mammary tumor virus-like; TPM, transcripts per million.

