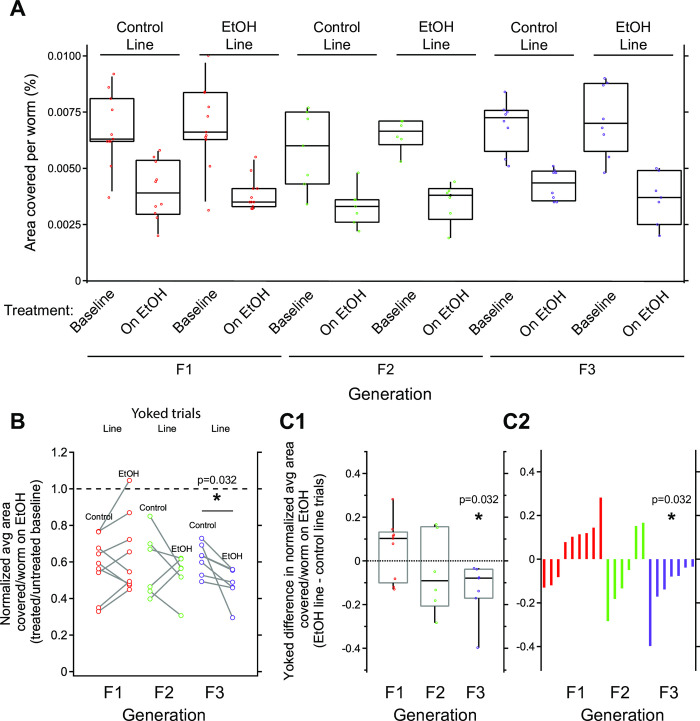
Fig 4. Chronic EtOH-line worms show hypersensitivity to intoxication in F3 generation when yoked-lineage groups are compared.
Data are organized the same as in Fig 3. A. Sensitivity to acute intoxication as measured by percent area covered per worm. Worms generally covered less area when treated with EtOH. No significant differences were observed for main effects of lineage or generation, nor after posthoc analysis of interactions between lineage and generation (Table 1). B. Locomotion values of EtOH-treated worms normalized to baseline. Yoked values are linked with a gray line. A two-sided, paired t-test revealed a significant difference between normalized locomotion for control- and EtOH-line worms in F3 generation, but not F1 or F2 generations (p = 0.032). C1. To visualize differences between yoked control- and EtOH-line trials, we plotted yoked difference values. These distributions were not different than zero for F1 and F2, but significantly lower than zero for F3 animals (One sample t-test, p = 0.032). C2. Distributions from panel C1 replotted in ranked order to highlight shift towards n values for F3 in comparison to F1 and F2 generations. A-C. Box plots represent top and bottom 25–75% and median.

