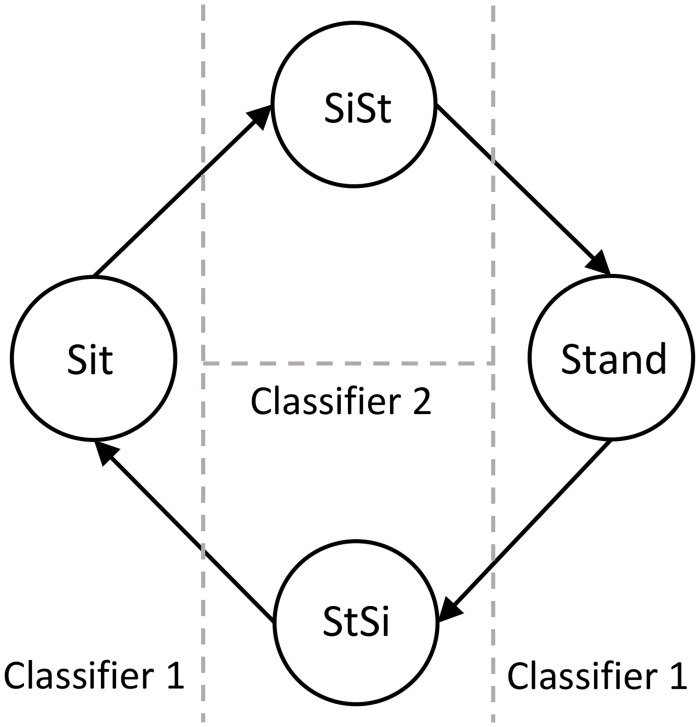
Fig 3. Classification scheme for sit, stand, sit-to-stand and stand-to-sit.
State diagram representing the classification scheme for sit, stand, sit-to-stand and stand-to-sit. The vertical dashed line represents the threshold for the Classifier 1 to classify the stationary state and the transition state. The horizontal dashed line represents the classification boundary for Classifier 2 to classify the transition state into sit-to-stand and stand-to-sit.

