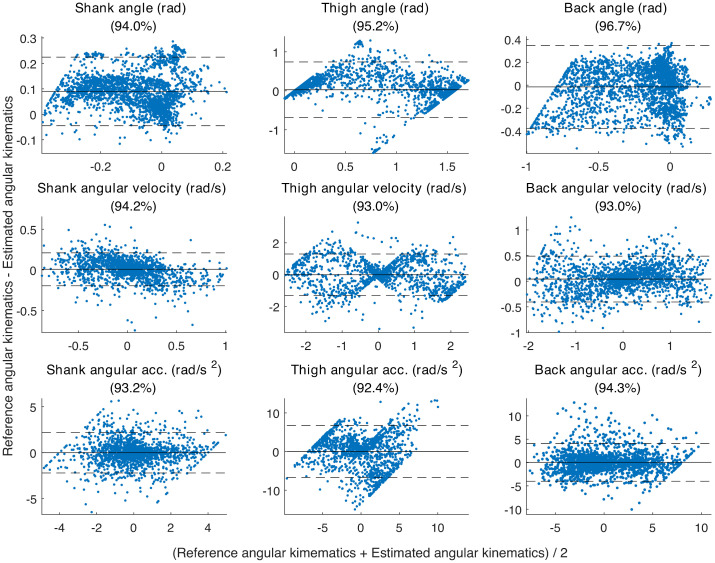
Fig 7. Bland-Altman plots.
The Bland-Altman plots showing comparison between the reference Codamotion angular kinematics and estimated angular kinematics using the proposed integrated approach of modelling and classification for the shank, thigh and back. The x-axis shows the mean of the two measures and the y-axis shows the difference between the two measures. The solid horizontal represents the mean difference between the reference and estimated kinematics and the dotted horizontal lines show the ±2 standard deviation boundaries. A Bland-Altman plot typically looks for points to be within ±2 standard deviations of the mean difference, the title of each sub-figure has this as percentage.

