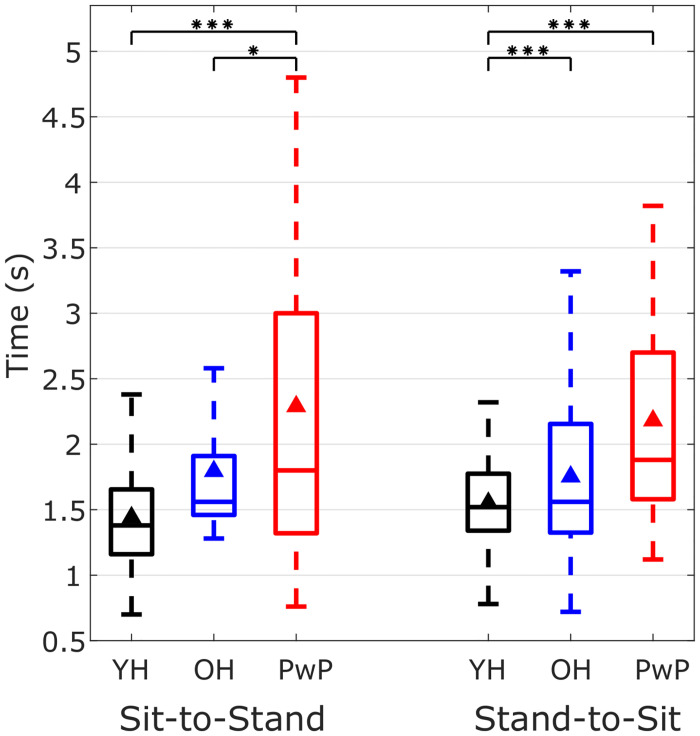
Fig 9. Timings of sit-to-stand and stand-to-sit in younger healthy (YH) adults, older healthy (OH) adults and people with Parkinsons (PwP).
The time taken by participants to perform sit-to-stand and stand-to-sit from all the three YH, OH and PwP groups. The black triangle shows the mean time. Statistically significant differences (Mann-Whitney U test with Bonferroni correction for multiple tests) in the timings among the three groups for sit-to-stand and stand-to-sit are shown by the stars indicting the p-values (one star indicates p < 0.5, two stars indicate p < 0.01 and three stars indicate p < 0.001).

